Fig. A.1
Download original image
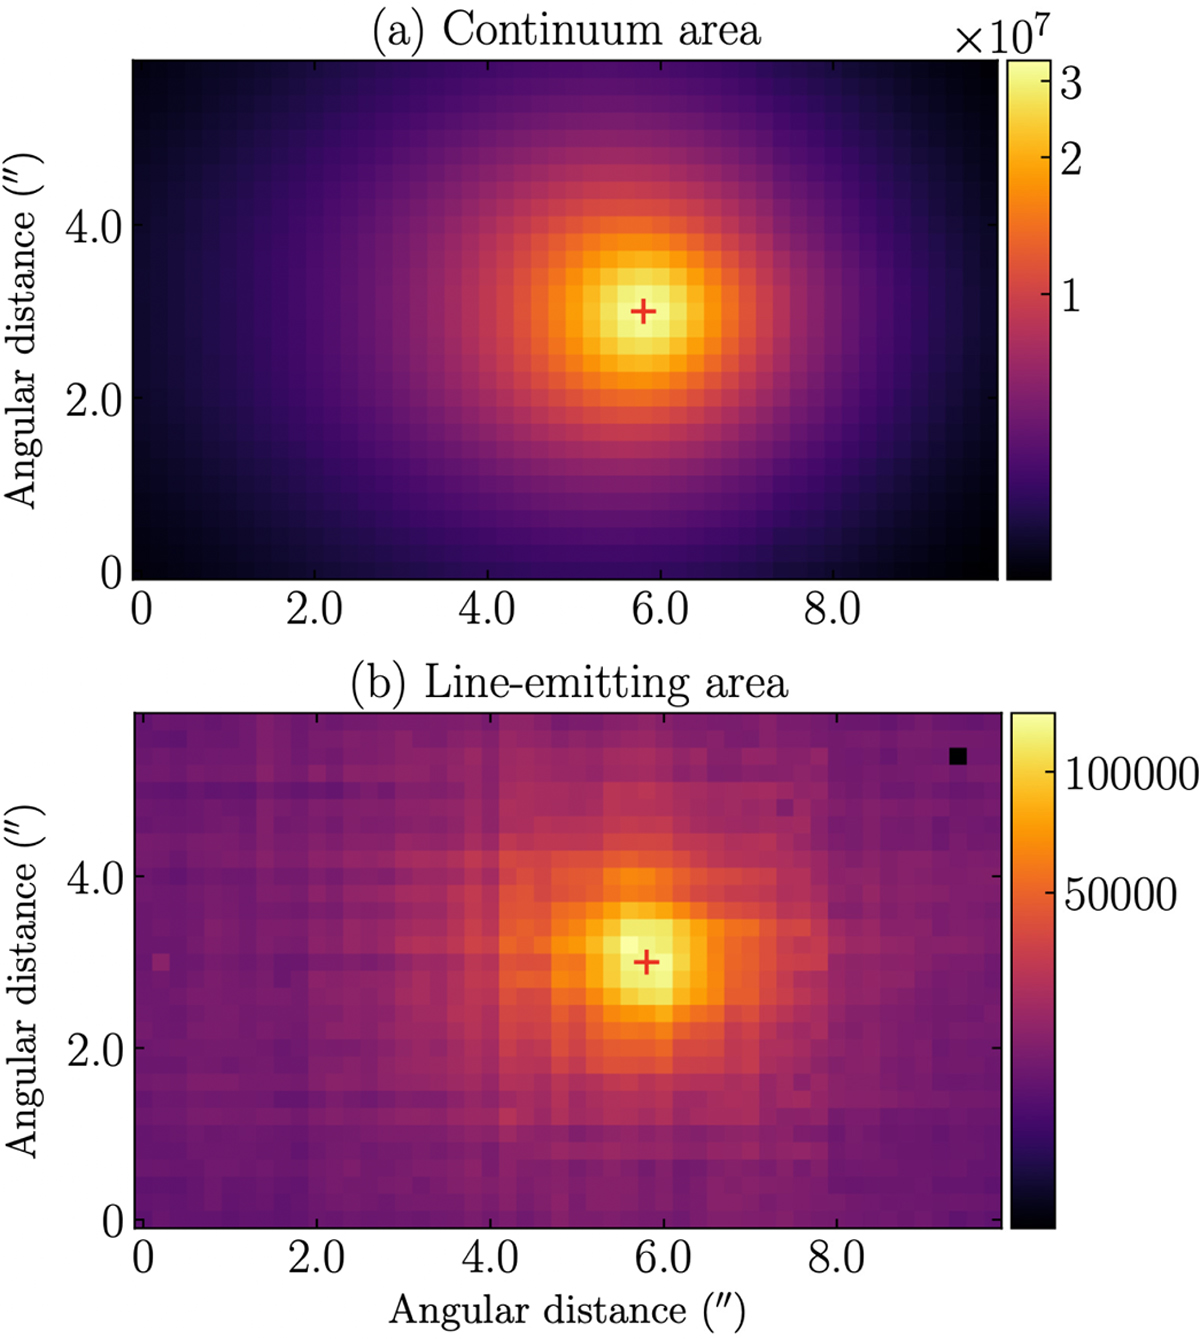
Unbinned flux image of (a) the continuum-emitting area and (b) the line-emitting area with contributions from all gas species. Units of axes and color bars are pixels and flux in 10−20 erg cm−2 s−1, respectively. One pixel corresponds to ρ ∼ 270 km, such that the cropped FoV covers the ∼8 100 km × 13 500 km rectangular coma region. The red plus sign (+) indicates the optocenter. The images are aligned as in Figure 3.
Current usage metrics show cumulative count of Article Views (full-text article views including HTML views, PDF and ePub downloads, according to the available data) and Abstracts Views on Vision4Press platform.
Data correspond to usage on the plateform after 2015. The current usage metrics is available 48-96 hours after online publication and is updated daily on week days.
Initial download of the metrics may take a while.