Open Access
Fig. 6
Download original image
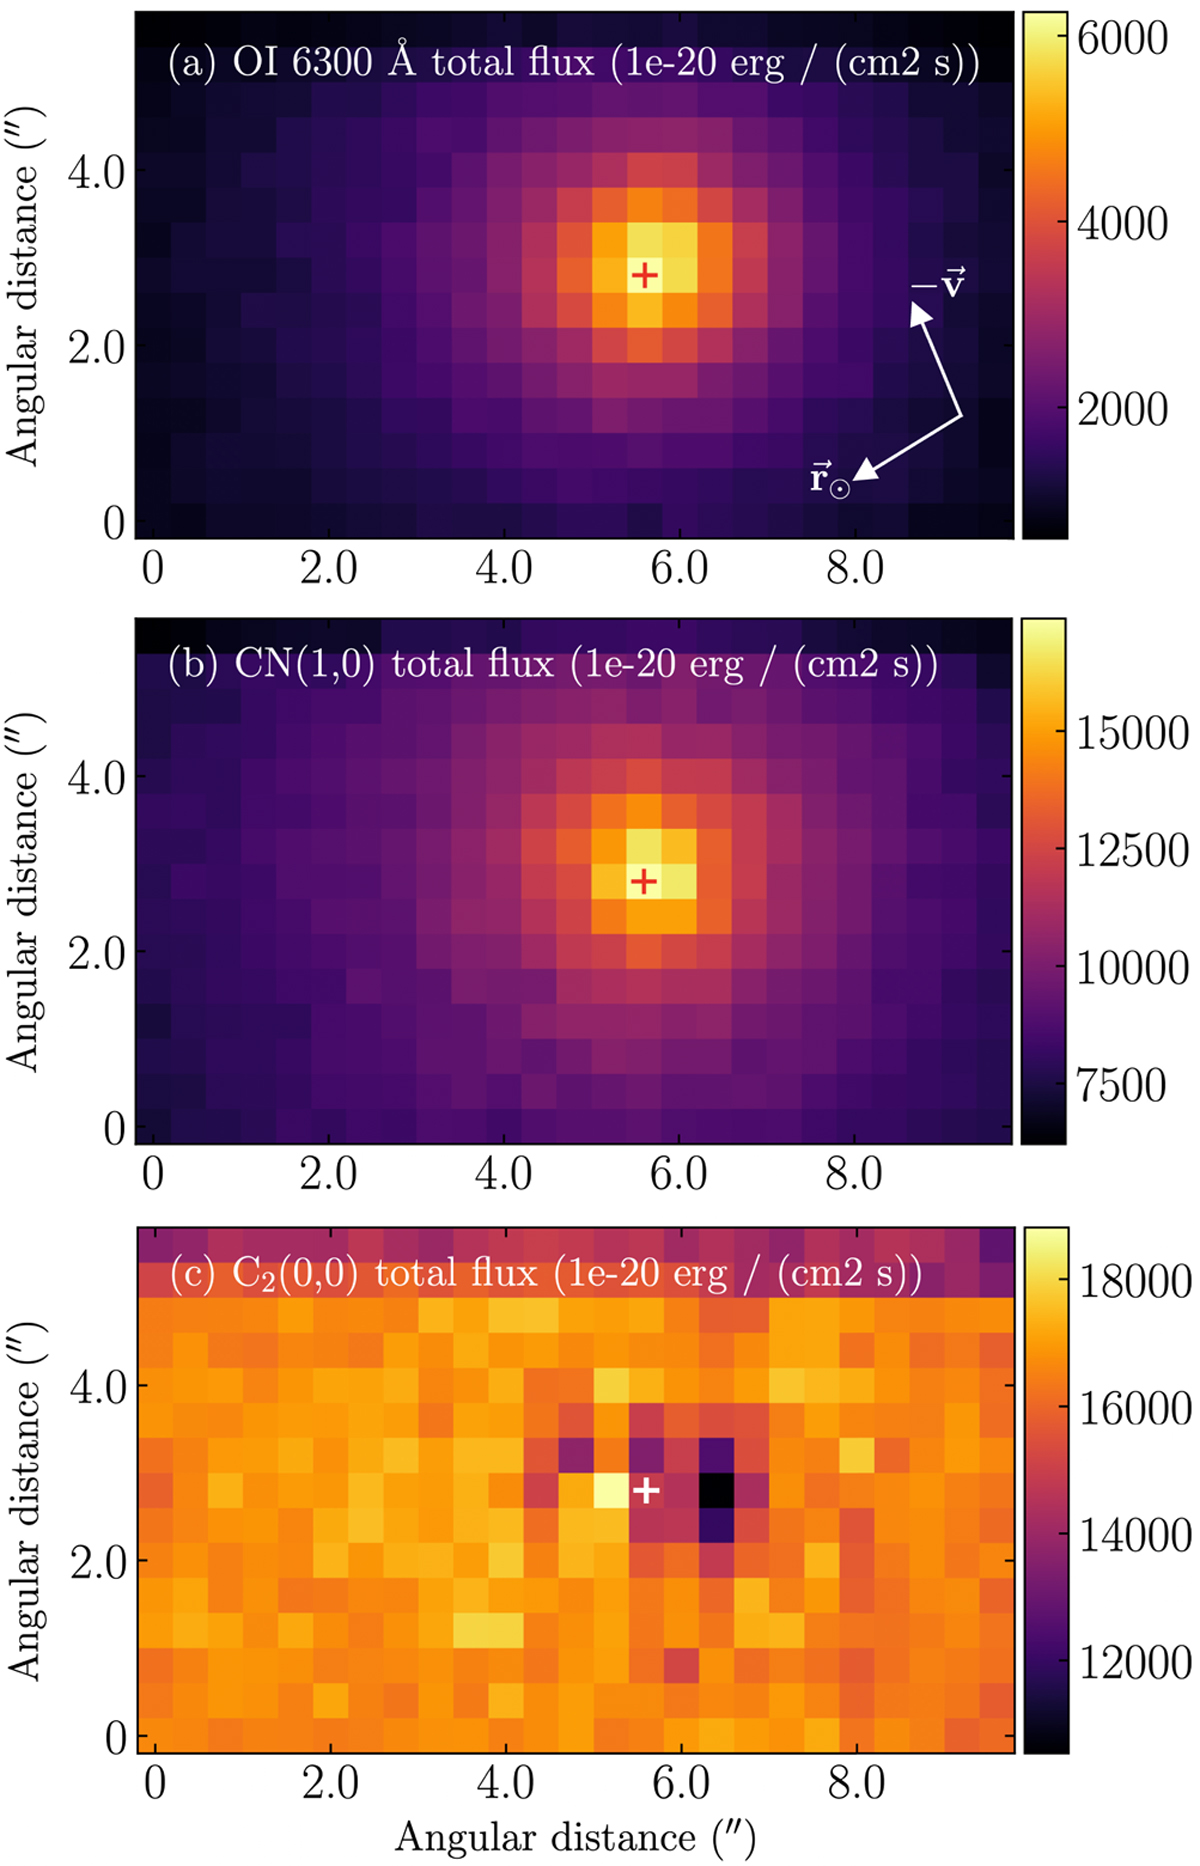
2 × 2 binned flux distribution of (a) OI1D line, (b) CN(1,0) red band, and (c) C2(0,0) Swan band in units of 10−20 erg cm−2 s−1. The plus sign (+) indicates the optocenter. The images have the same FoV, pixel scales, and alignment directions as those in Fig. 3b.
Current usage metrics show cumulative count of Article Views (full-text article views including HTML views, PDF and ePub downloads, according to the available data) and Abstracts Views on Vision4Press platform.
Data correspond to usage on the plateform after 2015. The current usage metrics is available 48-96 hours after online publication and is updated daily on week days.
Initial download of the metrics may take a while.