Fig. 1
Download original image
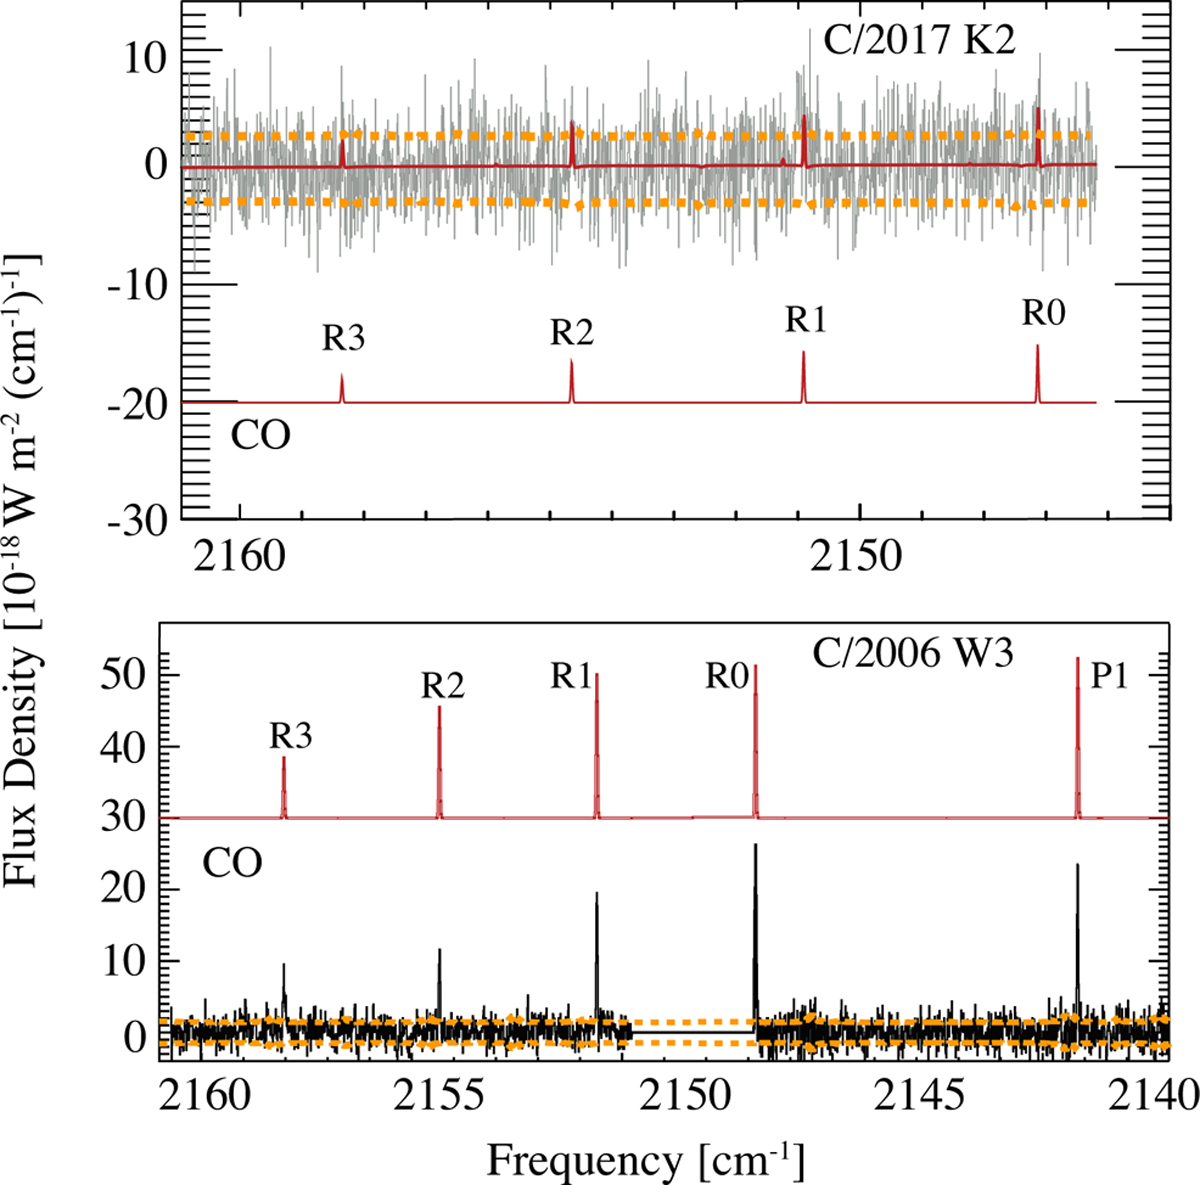
Comparison between CO spectra of K2 (observed in July with ESO/CRIRES+) and C/2006 W3 (Christensen) (observed in October 2009 with ESO/CRIRES). The comets were at heliocentric distances of 2.75 au and 3.25 au, respectively. In both panels, the red lines indicate the CO model, while the dotted yellow lines are the ±1σ noise. C/2006 W3 (Christensen) shows very strong CO emission lines even if at a larger heliocentric distance than K2 (bottom panel, adapted from Bonev et al. 2017), while CO lines for K2 are at the noise level (top panel, Lippi et al., in prep.).
Current usage metrics show cumulative count of Article Views (full-text article views including HTML views, PDF and ePub downloads, according to the available data) and Abstracts Views on Vision4Press platform.
Data correspond to usage on the plateform after 2015. The current usage metrics is available 48-96 hours after online publication and is updated daily on week days.
Initial download of the metrics may take a while.