Fig. 6.
Download original image
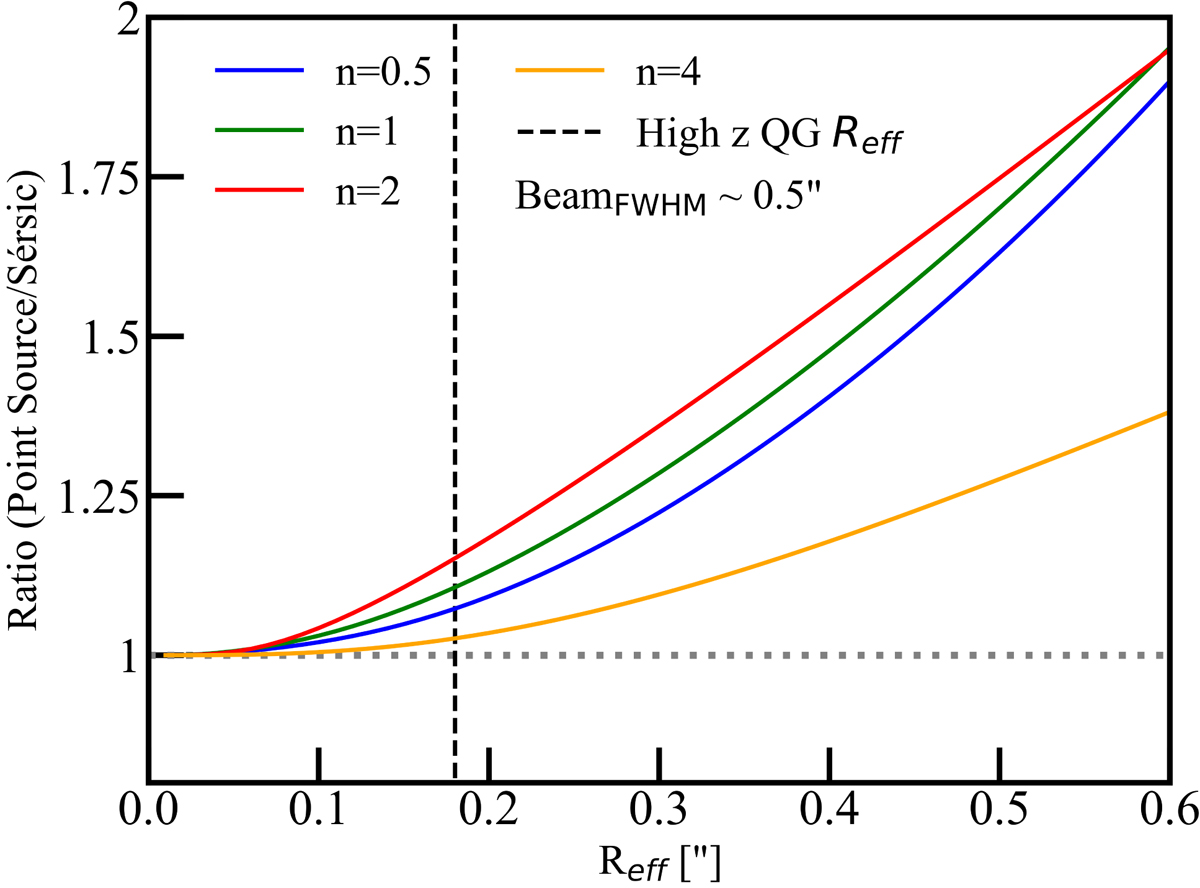
Size assumption effect. Flux correction factor ratio between the assumed point source emission and a modelled galaxy profile as a function of effective radius. Each colored line shows the ratios for profiles with different Sérsic indexes. The black vertical dashed line represents a size reference of Reff based on the stellar component size of QGs at z ∼ 1.5 with log(M*/M⊙) = 10.7 (van der Wel et al. 2014).
Current usage metrics show cumulative count of Article Views (full-text article views including HTML views, PDF and ePub downloads, according to the available data) and Abstracts Views on Vision4Press platform.
Data correspond to usage on the plateform after 2015. The current usage metrics is available 48-96 hours after online publication and is updated daily on week days.
Initial download of the metrics may take a while.