Open Access
Fig. 2.
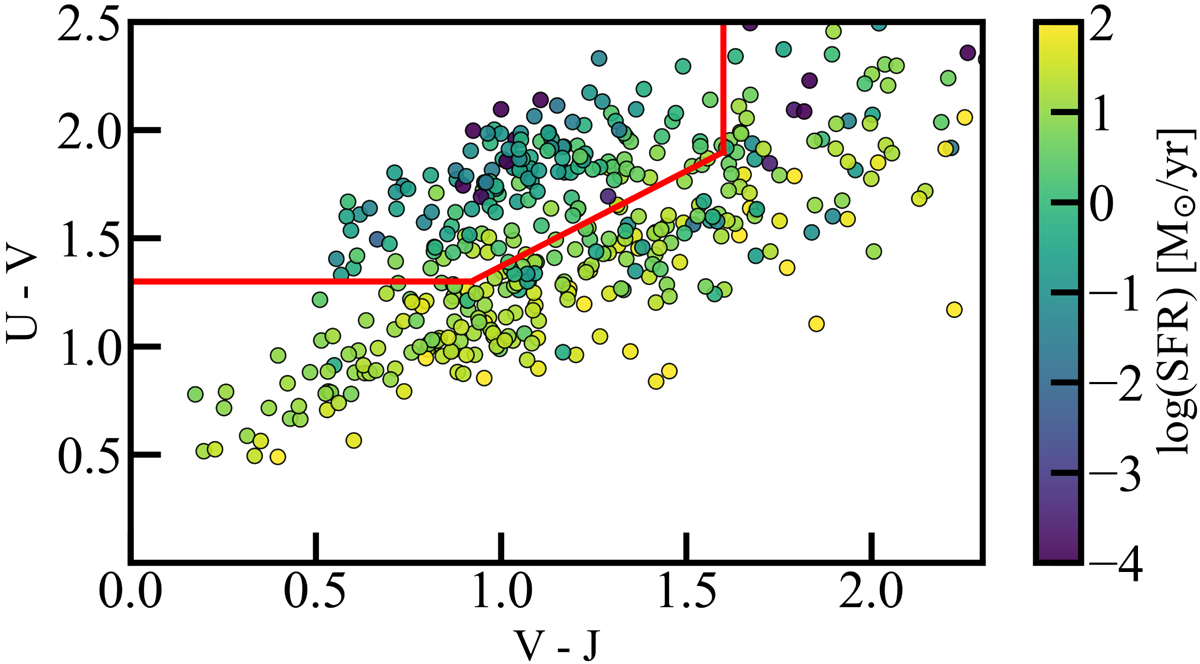
Download original image
UVJ colour diagram. Distribution of the parent sample of 435 galaxies that meet our selection criteria in the U − V, V − J colour–colour space, colour-coded by their log(SFR). The red box represents the quiescent region limits defined in Schreiber et al. (2015), which enclose the 140 QGs from which we drew our final sample.
Current usage metrics show cumulative count of Article Views (full-text article views including HTML views, PDF and ePub downloads, according to the available data) and Abstracts Views on Vision4Press platform.
Data correspond to usage on the plateform after 2015. The current usage metrics is available 48-96 hours after online publication and is updated daily on week days.
Initial download of the metrics may take a while.