Open Access
Fig. 7
Download original image
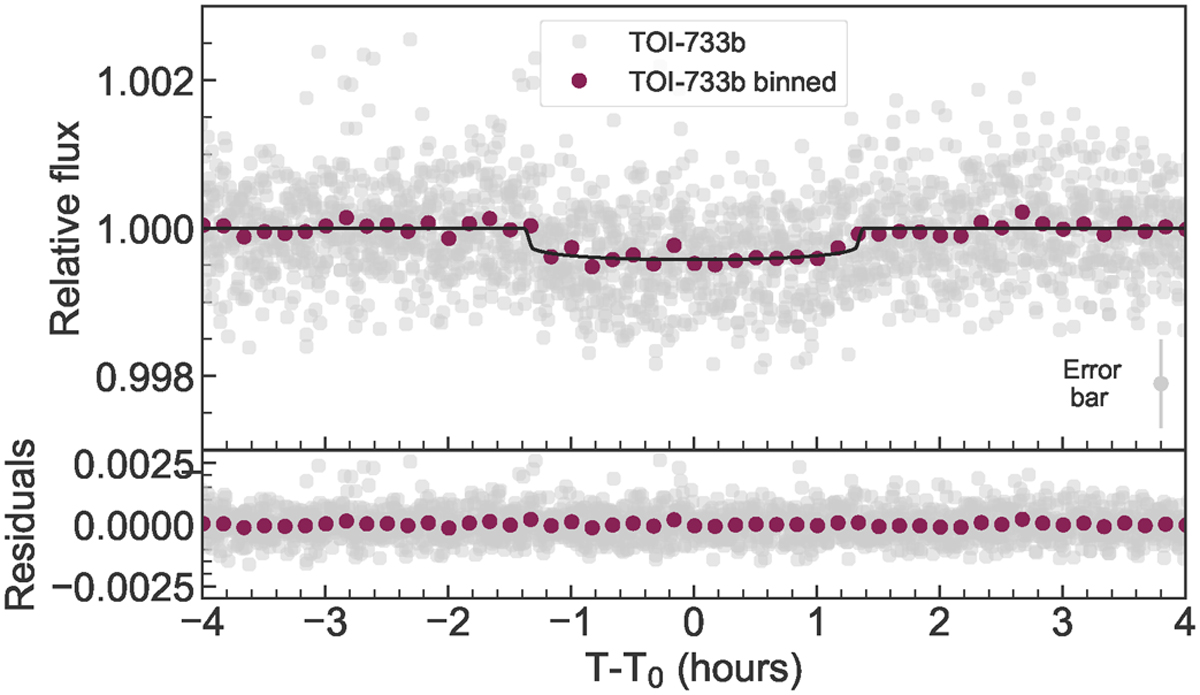
TOI-733 b phase-folded and detrended transits from both TESS sectors, with residuals. The best-fitting transit model is marked by the black curve. Two-minute nominal cadence data points binned to 10 min are shown in grey and green, respectively. The typical error bar is added in the bottom right corner.
Current usage metrics show cumulative count of Article Views (full-text article views including HTML views, PDF and ePub downloads, according to the available data) and Abstracts Views on Vision4Press platform.
Data correspond to usage on the plateform after 2015. The current usage metrics is available 48-96 hours after online publication and is updated daily on week days.
Initial download of the metrics may take a while.