Open Access
Fig. 6
Download original image
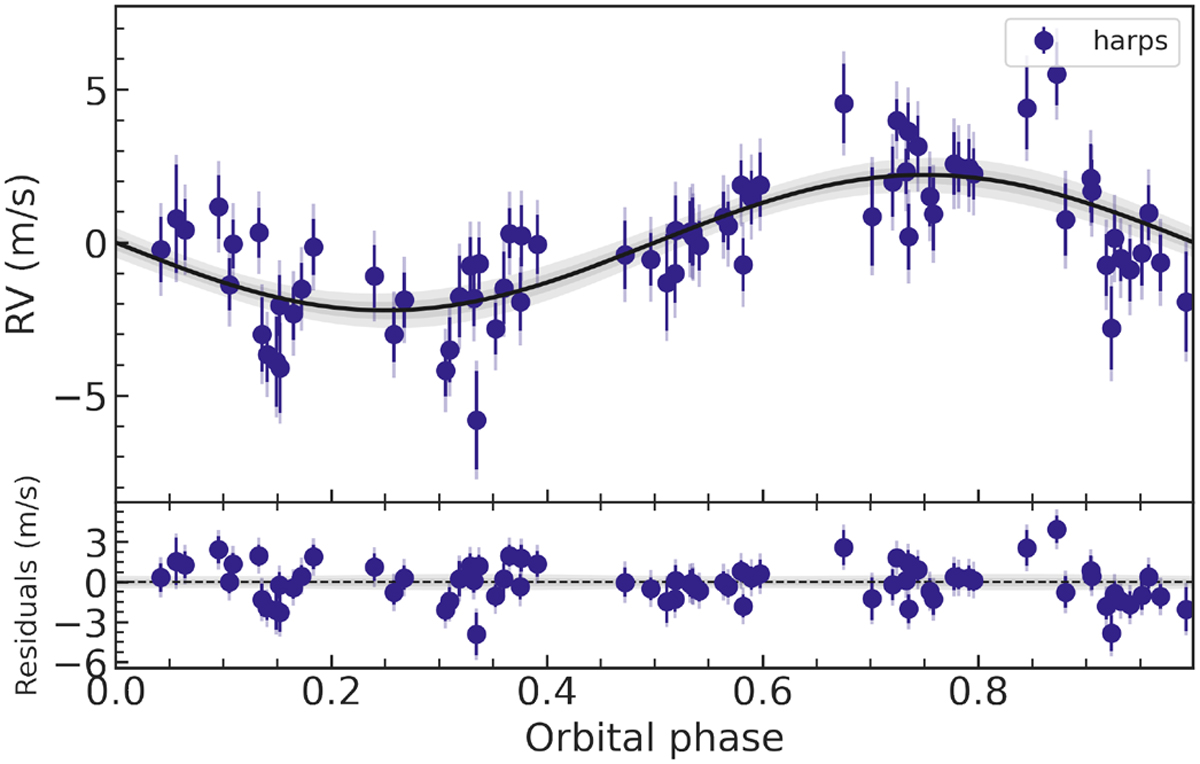
HARPS RV data (purple points) and inferred model (solid black curve) phase-folded on the orbital period of TOI-733 b. 1- and 2 σ credible intervals in shaded grey regions are also shown. Nominal and jitter error bars are plotted in solid and semi-transparent purple, respectively.
Current usage metrics show cumulative count of Article Views (full-text article views including HTML views, PDF and ePub downloads, according to the available data) and Abstracts Views on Vision4Press platform.
Data correspond to usage on the plateform after 2015. The current usage metrics is available 48-96 hours after online publication and is updated daily on week days.
Initial download of the metrics may take a while.