Fig. 5
Download original image
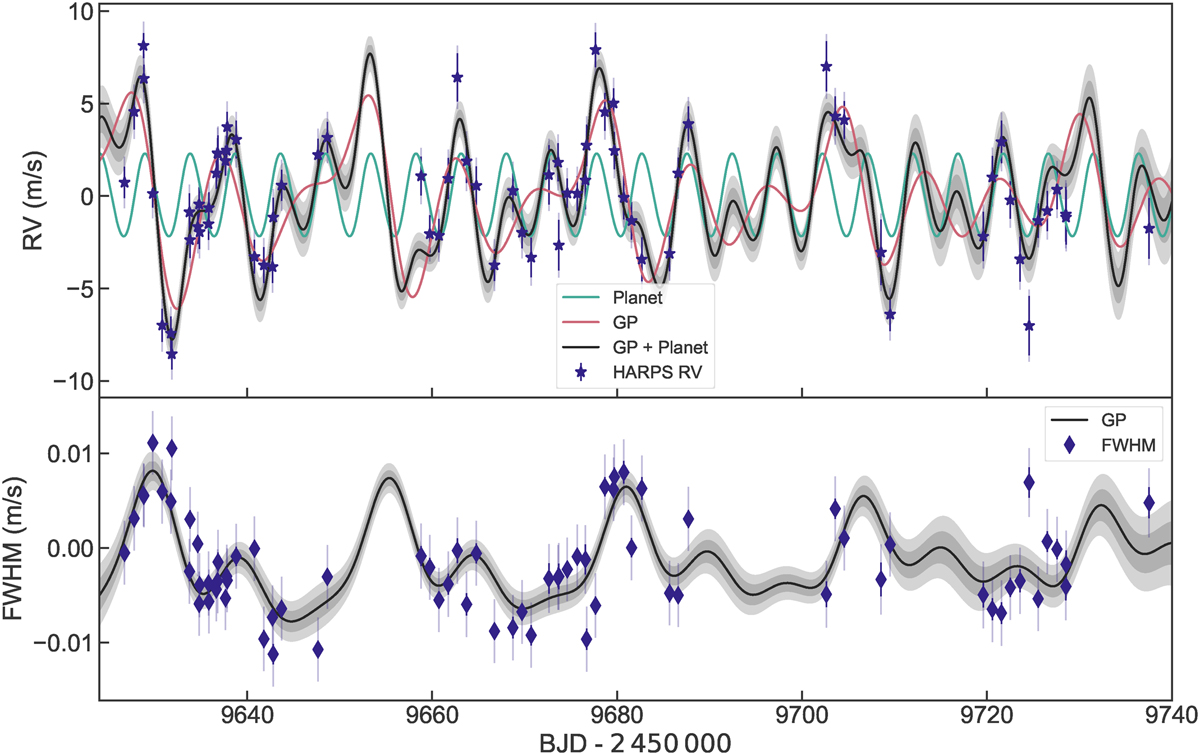
RV (top panel) and FWHM (bottom panel) time series. The purple markers in each panel represent the HARPS RV and FWHM measurements with inferred offsets extracted. The inferred multi-GP model is shown as a solid black curve, where the dark and light shaded areas show the 1 - and 2σ credible intervals from this model, and can also explain the data, but with a correspondingly lower probability. The solid red line in the top panel shows the star-only model, and the teal sine curve shows the Keplerian for TOI-733 b. In both panels, the nominal error bars are plotted in solid purple, and the jitter error bars (σHAPRS) are semi-transparent purple.
Current usage metrics show cumulative count of Article Views (full-text article views including HTML views, PDF and ePub downloads, according to the available data) and Abstracts Views on Vision4Press platform.
Data correspond to usage on the plateform after 2015. The current usage metrics is available 48-96 hours after online publication and is updated daily on week days.
Initial download of the metrics may take a while.