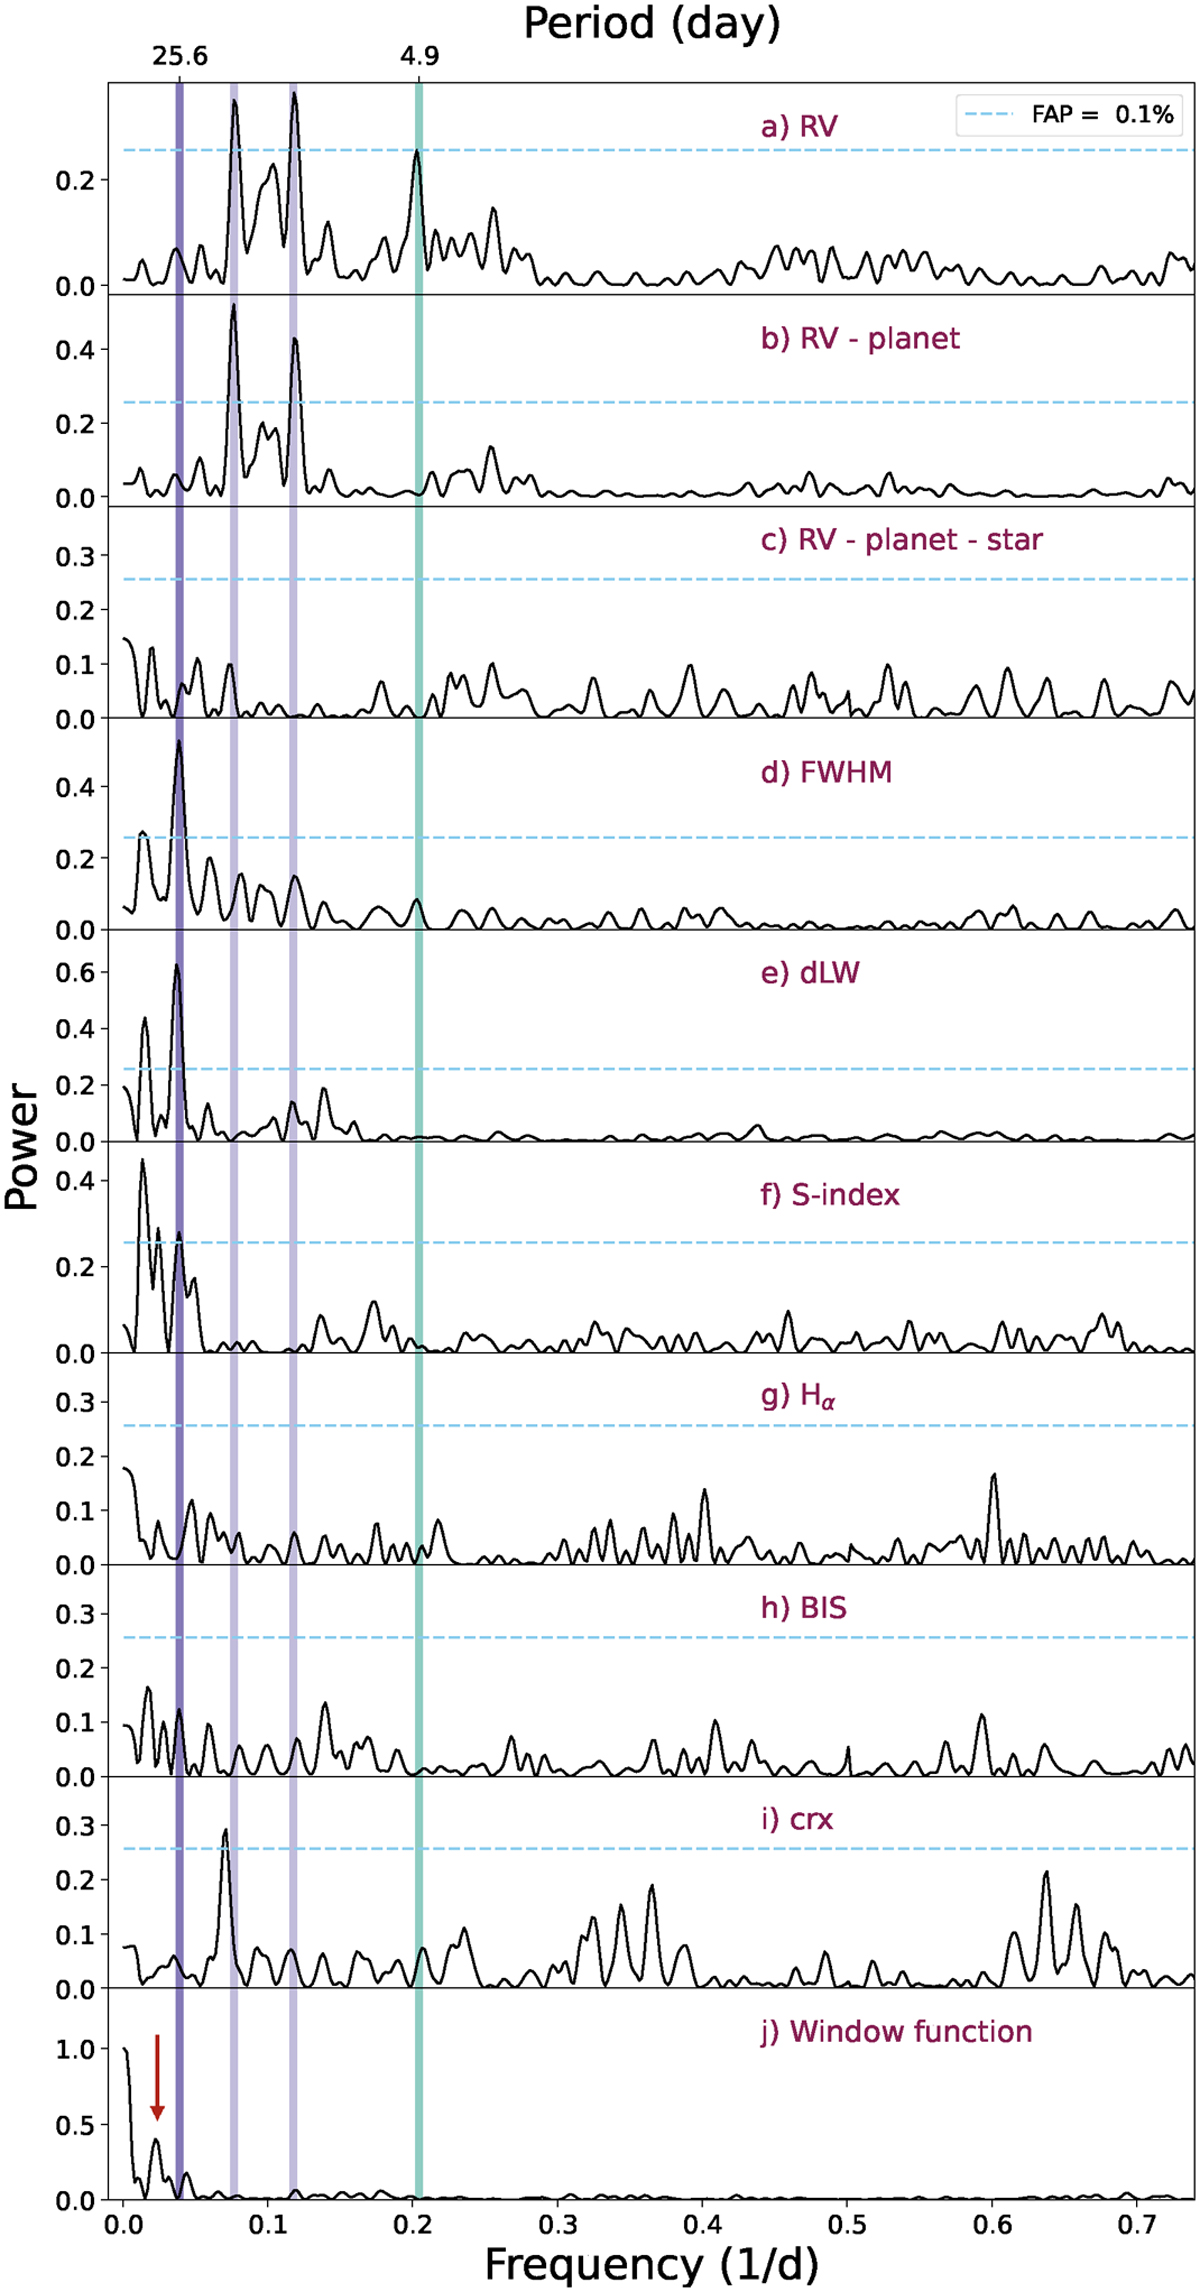
Fig. 3

Download original image
Generalized Lomb-Scargle periodograms of the spectroscopic data for TOI-733. From top to bottom, the top three panels correspond to the DRS RVs, to the RV residuals after fitting a sinusoid at the detected orbital period for TOI-733.01 (marked as solid vertical teal line), and to residuals after fitting the final multi-GP model presented in Sect. 4. The following panels show periodograms of spectral activity indicators, ending with the window function at the bottom, as annotated in each panel. The solid purple lines represent the frequency of the GP signal, which is particularly visible in the FWHM and dLW, while its first two harmonics in semi-transparent purple are well pronounced in the RVs. A peak at the first harmonic is also visible in panel i). The horizontal blue line shows the 0.1% FAP level.
Current usage metrics show cumulative count of Article Views (full-text article views including HTML views, PDF and ePub downloads, according to the available data) and Abstracts Views on Vision4Press platform.
Data correspond to usage on the plateform after 2015. The current usage metrics is available 48-96 hours after online publication and is updated daily on week days.
Initial download of the metrics may take a while.


