Fig. 1
Download original image
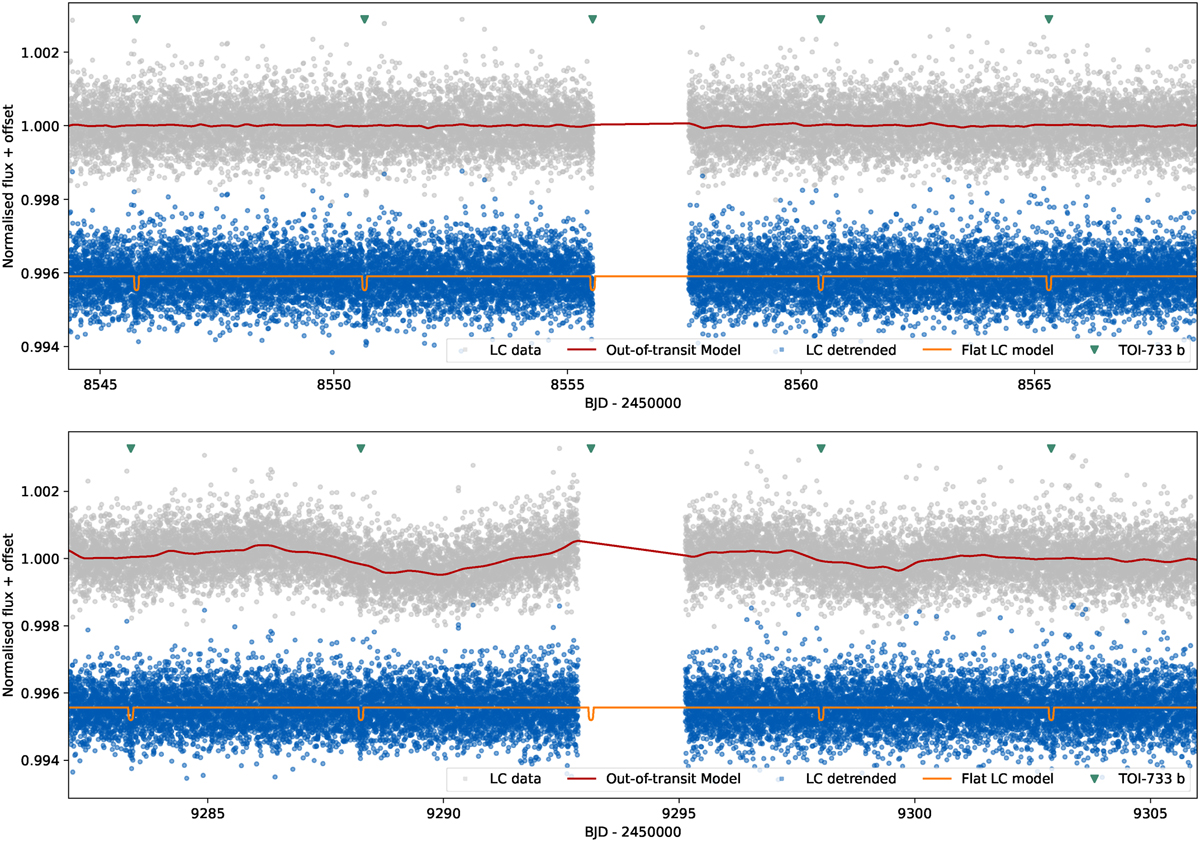
Light curves (LC) with a two-minute cadence in sectors 9 (top) and 36 (bottom) of TESS PDCSAP are plotted in grey. The locations of the individual transits of TOI-733 b are marked by green triangles. The GP-inferred model for the out-of-transit data is marked by the red curve. The vertically offset blue dots show the resulting detrended light curve, and the orange fit with transits is overplotted.
Current usage metrics show cumulative count of Article Views (full-text article views including HTML views, PDF and ePub downloads, according to the available data) and Abstracts Views on Vision4Press platform.
Data correspond to usage on the plateform after 2015. The current usage metrics is available 48-96 hours after online publication and is updated daily on week days.
Initial download of the metrics may take a while.