Fig. C.6.
Download original image
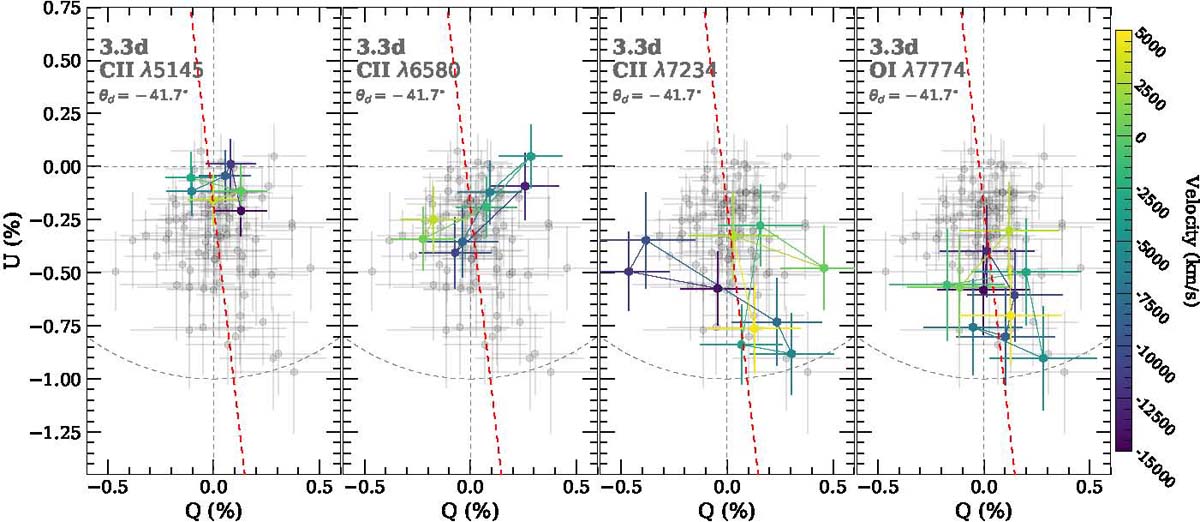
Notable line features on the Q – U plane of SN 2017gci at 3.3 d. The line regions are highlighted by velocities as indicated by the colour bar, while other data points are shown in grey. The dominant axis from Figure 3 is shown in dashed red. No loop-like structures are seen, but C IIλ6580 shows tentative deviation from the dominant direction.
Current usage metrics show cumulative count of Article Views (full-text article views including HTML views, PDF and ePub downloads, according to the available data) and Abstracts Views on Vision4Press platform.
Data correspond to usage on the plateform after 2015. The current usage metrics is available 48-96 hours after online publication and is updated daily on week days.
Initial download of the metrics may take a while.