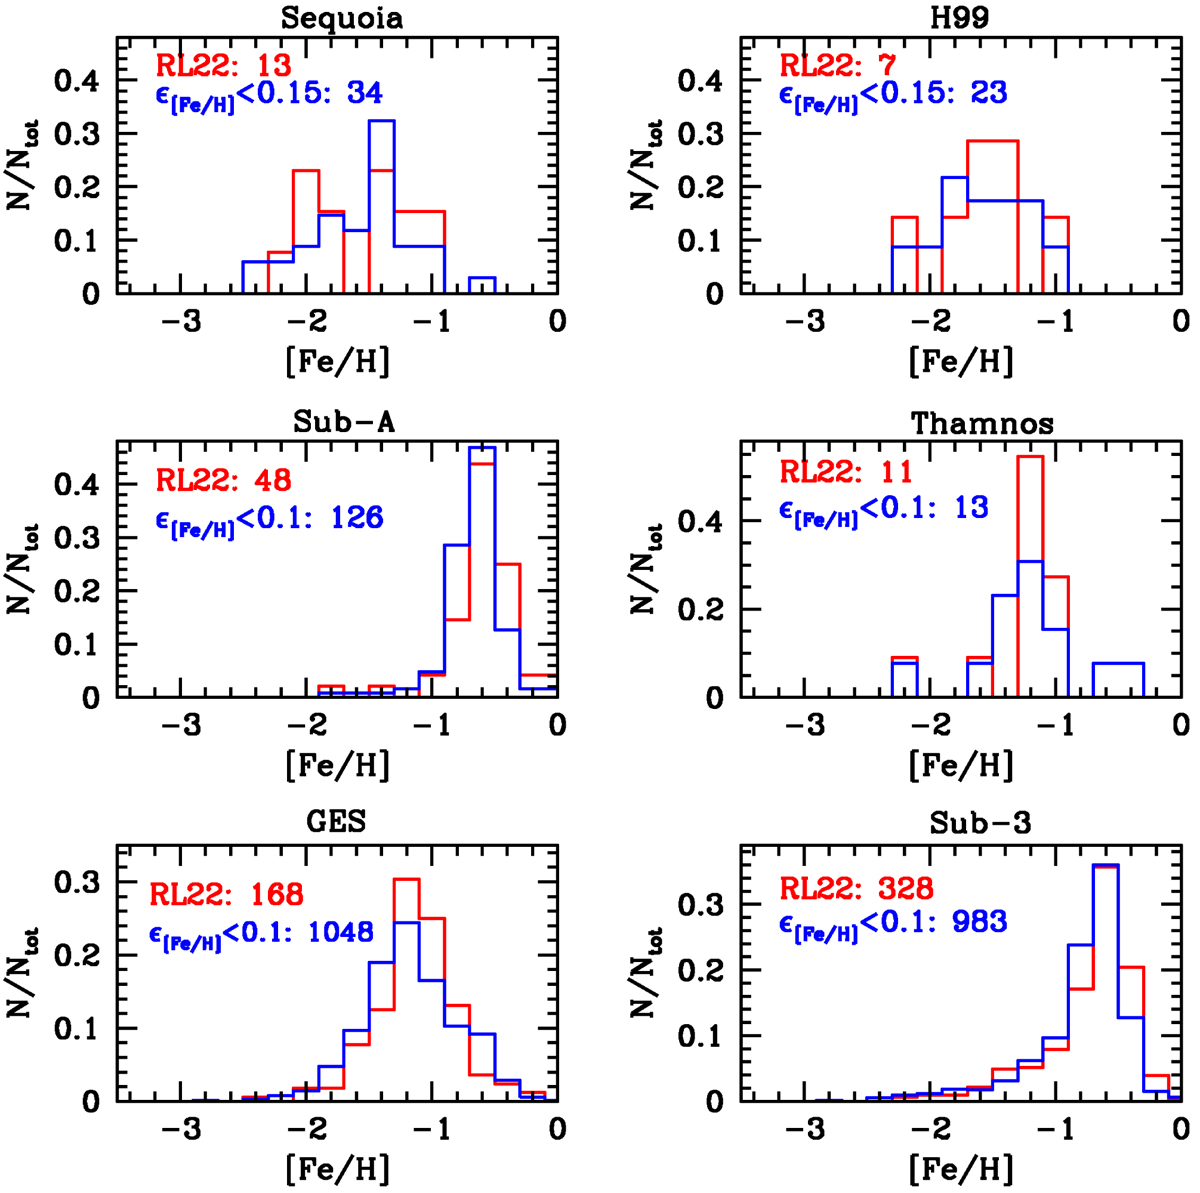
Fig. 9.
Download original image
Normalised MDFs for the six substructure under study, labelled at the top of each panel. The red histograms show the results obtained when only using stars in common with RL22, whereas the blue histograms show the distributions obtained with our own selection. The total number of stars used to build them is quoted in each panel, and is listed in Table 3.
Current usage metrics show cumulative count of Article Views (full-text article views including HTML views, PDF and ePub downloads, according to the available data) and Abstracts Views on Vision4Press platform.
Data correspond to usage on the plateform after 2015. The current usage metrics is available 48-96 hours after online publication and is updated daily on week days.
Initial download of the metrics may take a while.