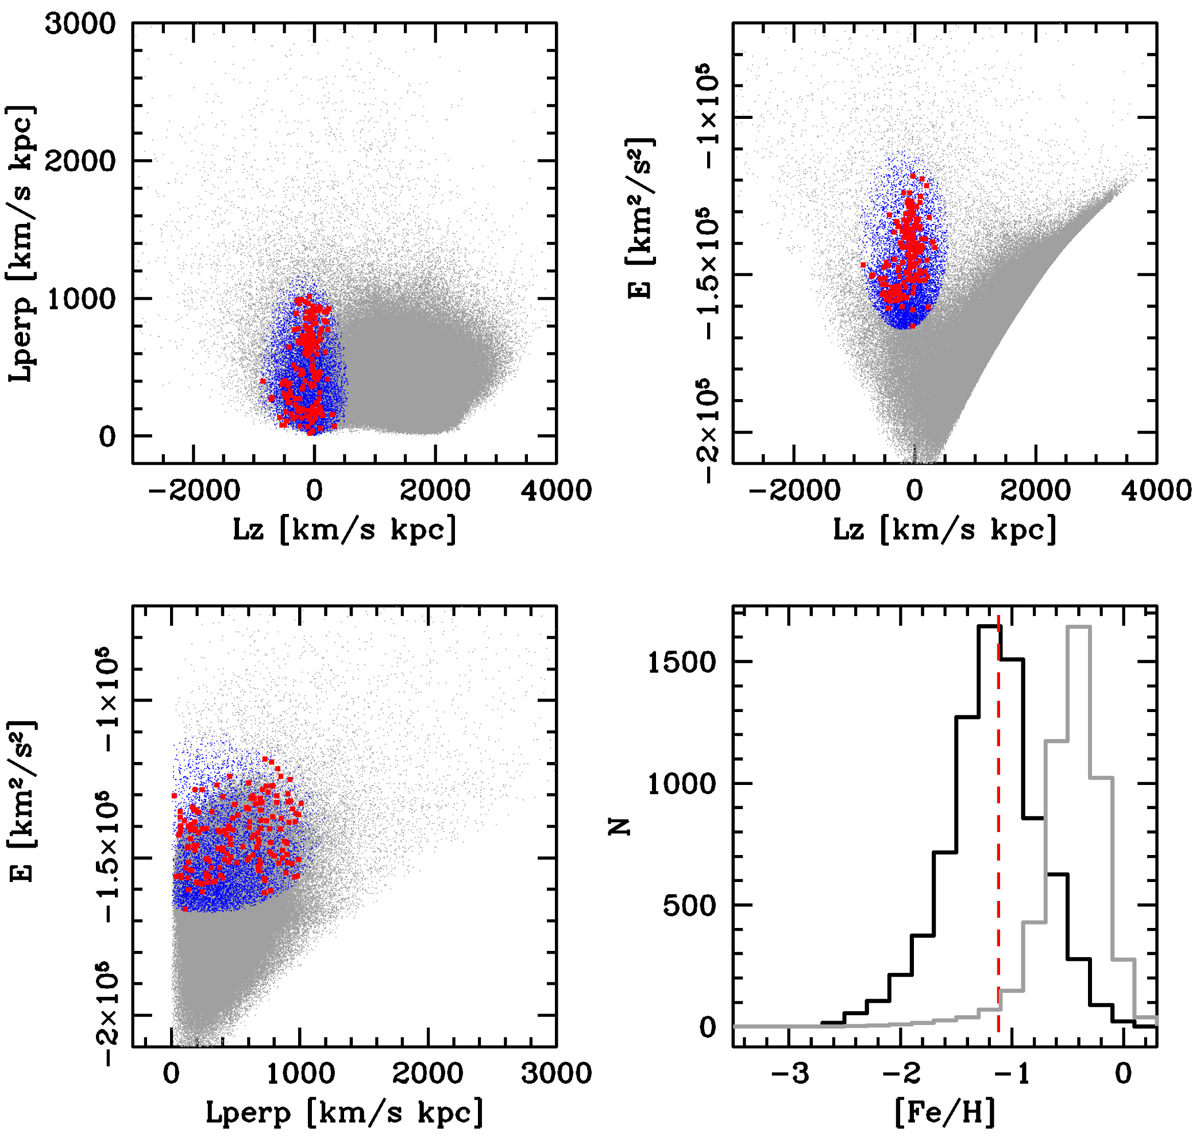
Fig. 8.
Download original image
Example of substructure selection. The upper panels and the lower left panel show the location of the whole sample (grey dots) in the dynamical spaces described by Lz, Lperp, and E. The red thick dots indicate stars in common with the list of GES stars from Lövdal et al. (2022) and Ruiz-Lara et al. (2022). The blue symbols indicate our selection of likely GES members. The lower right panel shows the MDF for this selection of GES stars (black histogram) and that for the entire sample, normalised to the peak of the former (grey histogram). The red dashed line is the mean [Fe/H] quoted by Ruiz-Lara et al. (2022) for their own GES selection.
Current usage metrics show cumulative count of Article Views (full-text article views including HTML views, PDF and ePub downloads, according to the available data) and Abstracts Views on Vision4Press platform.
Data correspond to usage on the plateform after 2015. The current usage metrics is available 48-96 hours after online publication and is updated daily on week days.
Initial download of the metrics may take a while.