Fig. 6.
Download original image
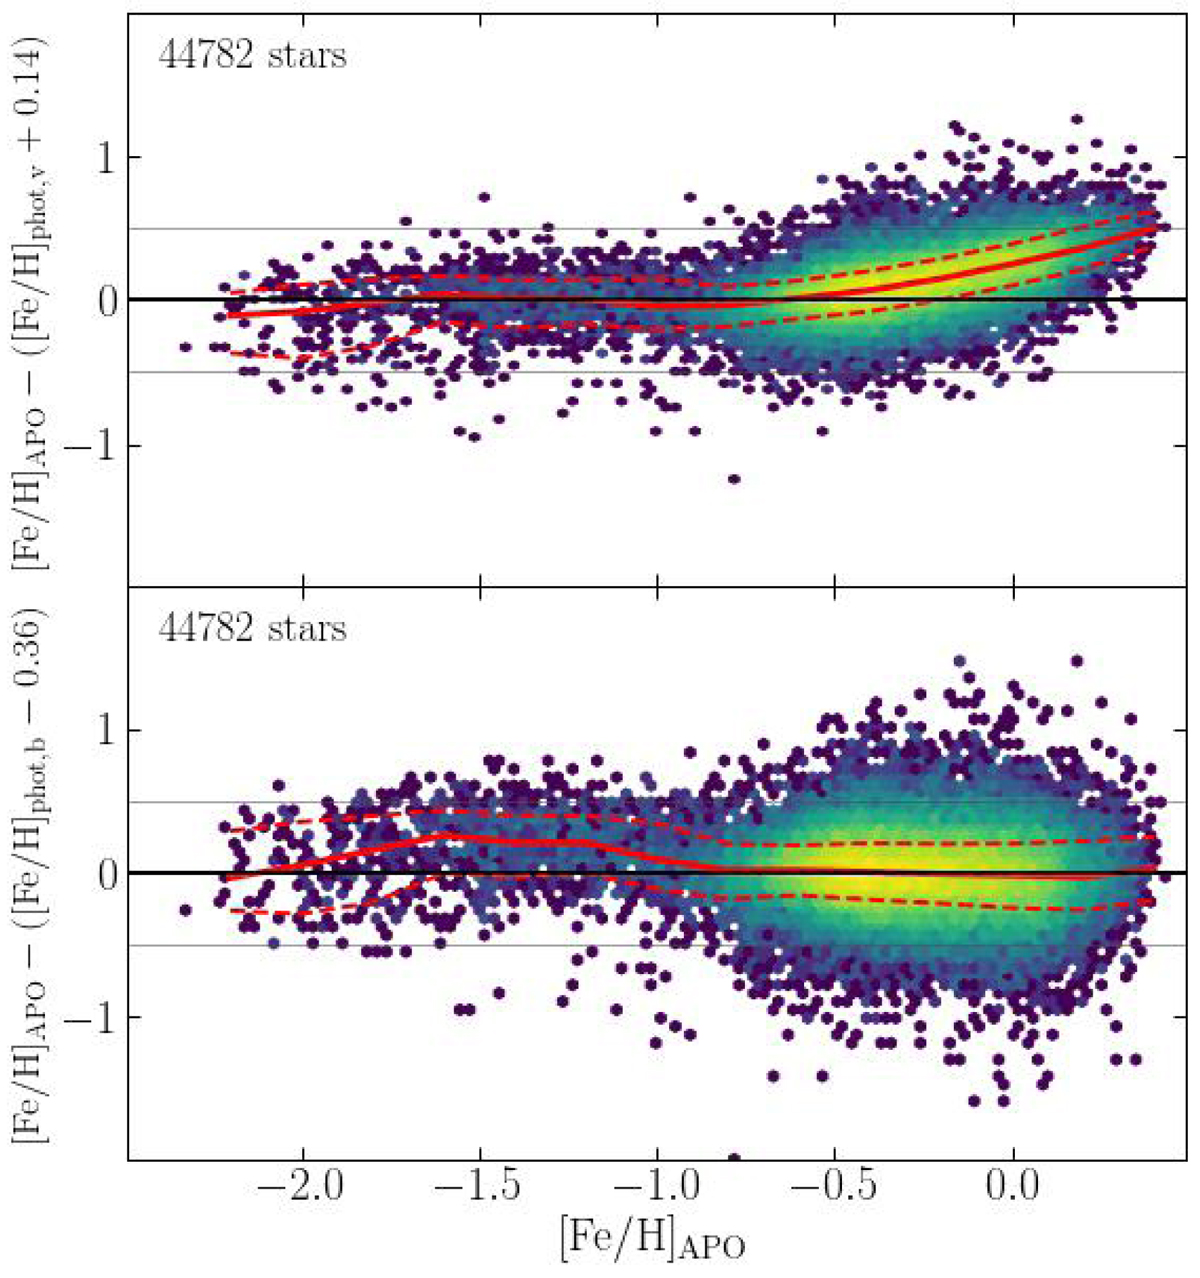
Differences between the spectroscopic and photometric metallicities as a function of spectroscopic metallicity for APOGEE VS, for [Fe/H]phot, v (upper panel) and [Fe/H]phot, b (lower panel). The horizontal grey lines are located at Δ[Fe/H] = ±0.5 dex. The continuous red lines trace P50 and the dashed red lines P16 and P84 of the Δ[Fe/H] distribution. A shift of +0.14 dex has been applied to [Fe/H]phot, v to minimise the median Δ[Fe/H] in the region [Fe/H]spec ≤ −0.8, while a shift of −0.36 dex was applied to [Fe/H]phot, b to minimise the median Δ[Fe/H] in the region [Fe/H]spec ≥ −0.8.
Current usage metrics show cumulative count of Article Views (full-text article views including HTML views, PDF and ePub downloads, according to the available data) and Abstracts Views on Vision4Press platform.
Data correspond to usage on the plateform after 2015. The current usage metrics is available 48-96 hours after online publication and is updated daily on week days.
Initial download of the metrics may take a while.