Fig. D.1.
Download original image
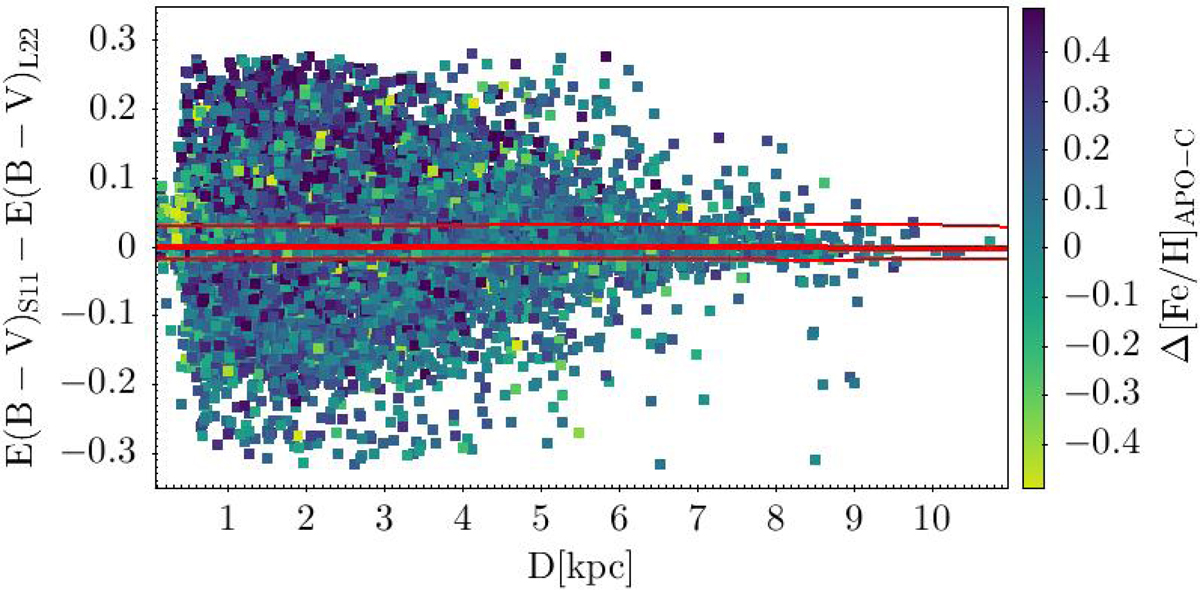
Difference between the reddening estimates adopted here, from Schlafly & Finkbeiner (2011, S11), and those obtained from the distance-dependent maps by Lallement et al. (2022, L22) as a function of distance from the Sun. Points are colour-coded according to Δ[Fe/H]APO − C = [Fe/H]APO − [Fe/H]C. The thick red line is P50 and the thin red lines are P16 and P84 of the distribution of the E(B-V) difference computed over 0.5 kpc wide bins.
Current usage metrics show cumulative count of Article Views (full-text article views including HTML views, PDF and ePub downloads, according to the available data) and Abstracts Views on Vision4Press platform.
Data correspond to usage on the plateform after 2015. The current usage metrics is available 48-96 hours after online publication and is updated daily on week days.
Initial download of the metrics may take a while.