Fig. 3.
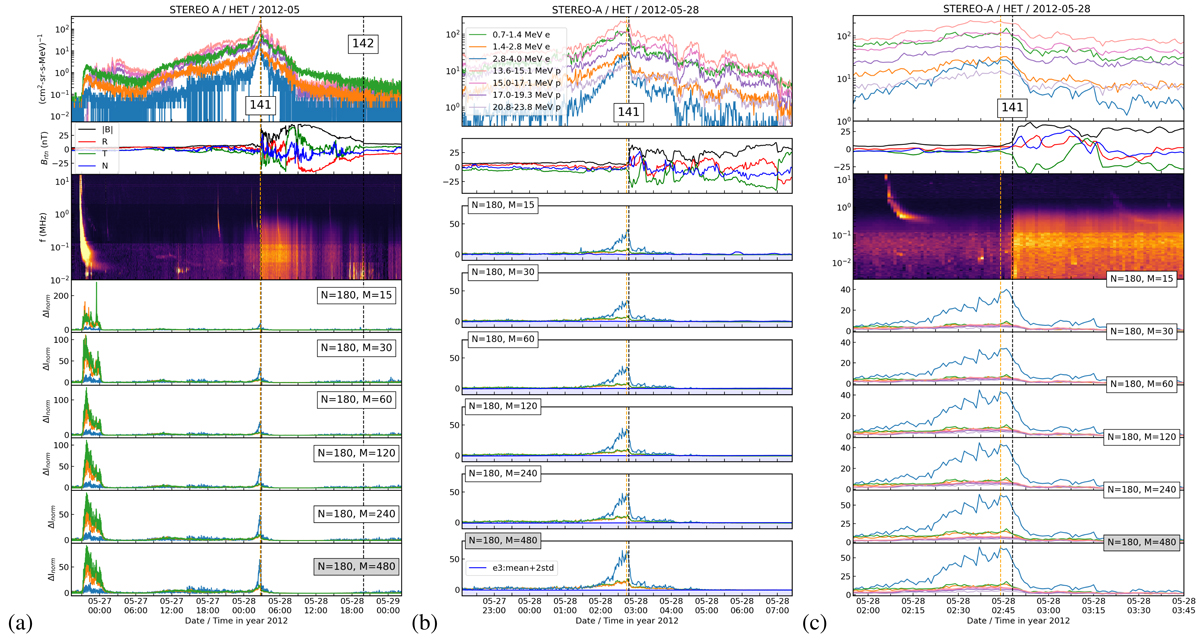
Download original image
SEP event on 27 May 2012 and corresponding ESP event on 28 May 2012 observed by STEREO A. From top to bottom, panel a shows the time profile of proton and electron intensities at different energy channels, as indicated in the legend in the top panel of b; the evolution of magnetic field magnitude and its components in RTN coordinates; and the STEREO/WAVES dynamic spectrum. The remaining six lower panels show the normalized data of the three electron channels using a fixed time lag parameter of (N = 180) and increasing window lengths M. Panels b and c are in the same format as panels b and c in Fig. 1. The boxes show the N and M values of each panel, and the gray-shaded box indicates the M value (among M1 to M6) that yields the most significant signal of the normalized data.
Current usage metrics show cumulative count of Article Views (full-text article views including HTML views, PDF and ePub downloads, according to the available data) and Abstracts Views on Vision4Press platform.
Data correspond to usage on the plateform after 2015. The current usage metrics is available 48-96 hours after online publication and is updated daily on week days.
Initial download of the metrics may take a while.