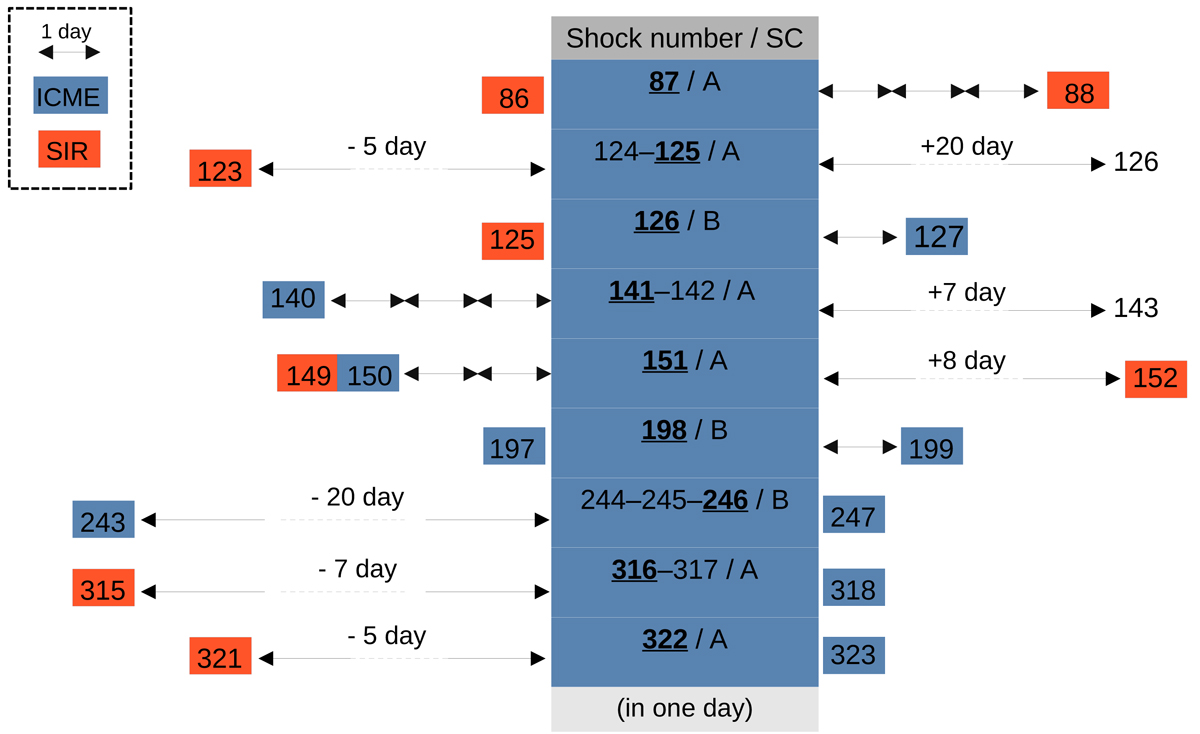
Fig. 2.
Download original image
Overview of the chosen events and the other associated shocks. All the numbers represent the shock number from the STEREO list (https://stereo-ssc.nascom.nasa.gov/pub/ins_data/impact/level3/STEREO_Level3_Shock.pdf). All of the ICME events in the blue central column occurred simultaneously with the relevant shock passage from our list of nine events. The nine numbers underlined and in bold indicate the events on our list. The SIR shocks from the list are represented by the number of shocks inside the red box. The two way arrows indicate a day and the plus or minus symbol with day denotes a duration of more than a day between the occurrence of two shocks.
Current usage metrics show cumulative count of Article Views (full-text article views including HTML views, PDF and ePub downloads, according to the available data) and Abstracts Views on Vision4Press platform.
Data correspond to usage on the plateform after 2015. The current usage metrics is available 48-96 hours after online publication and is updated daily on week days.
Initial download of the metrics may take a while.