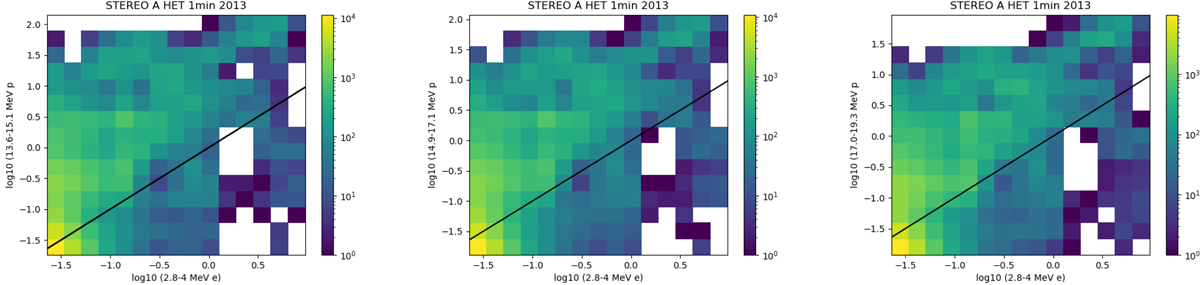
Fig. B.1.
Download original image
Two-dimensional histograms of varying proton versus 2.8–4.0. MeV electron intensities measured by STEREO-A/HET using one-minute data of the whole year of 2013. The plots show the logarithm of the intensities (excluding all zero intensities). The color scale (marking the number of observations in each bin) is logarithmic. The black solid line marks unity. The left, middle, and right panels show 13.6–15.1 MeV, 14.9– 17.1 MeV, and 17.0–19.3 MeV protons, respectively.
Current usage metrics show cumulative count of Article Views (full-text article views including HTML views, PDF and ePub downloads, according to the available data) and Abstracts Views on Vision4Press platform.
Data correspond to usage on the plateform after 2015. The current usage metrics is available 48-96 hours after online publication and is updated daily on week days.
Initial download of the metrics may take a while.