Fig. 1.
Download original image
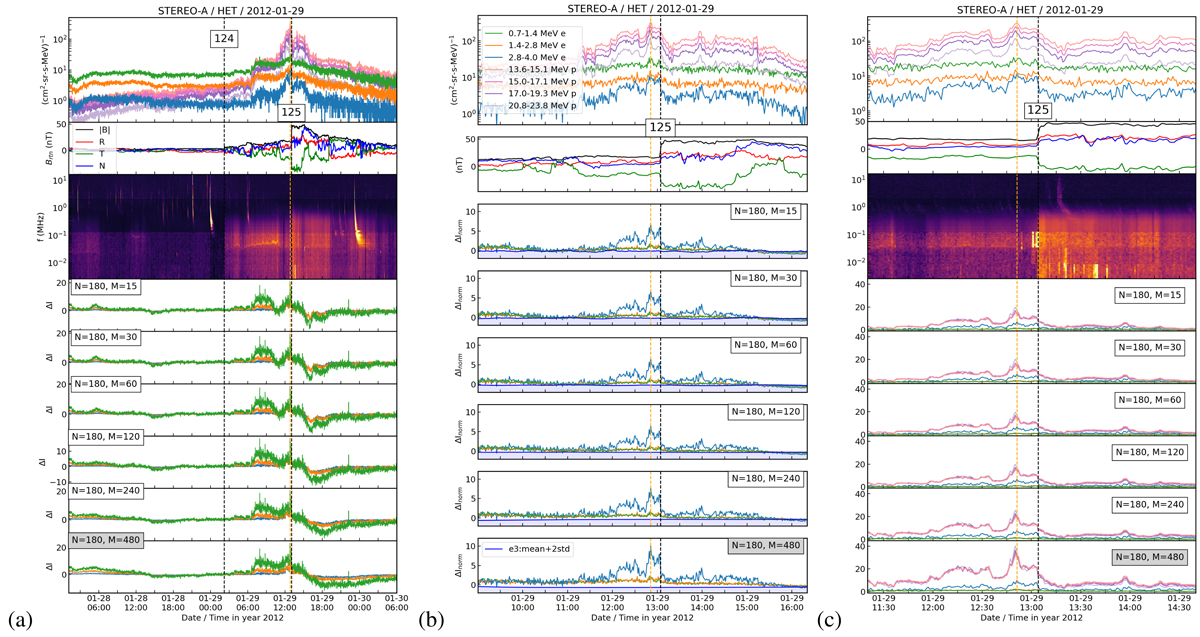
Analysis of the shock crossing on 29 January 2012 observed by STEREO-A. From top to bottom, panel a: Proton and electron intensity-time profiles as measured by HET, magnetic field vector magnitude, and components as measured by IMPACT/MAG; STEREO/WAVES dynamic spectrum; and background-corrected data as obtained with the fixed time lag parameter (N = 180) and increasing span parameter M. Panel b: Zoom in around time of shock number 125 passage with electron-normalized data. Panel c: Zoom in around time of shock number 125 passage with both electron- and proton-normalized data. The black vertical dashed line indicates the time of the shock passage over the spacecraft, and the orange dashed line marks the time of the peak intensity, Ipeak, in the electron energy channel, as it had the strongest response in terms of the normalized data. Each shaded area in panel b shows the running mean plus two SD level of the corresponding running background window for the electron energy channel, which had the strongest response in terms of the normalized data.
Current usage metrics show cumulative count of Article Views (full-text article views including HTML views, PDF and ePub downloads, according to the available data) and Abstracts Views on Vision4Press platform.
Data correspond to usage on the plateform after 2015. The current usage metrics is available 48-96 hours after online publication and is updated daily on week days.
Initial download of the metrics may take a while.