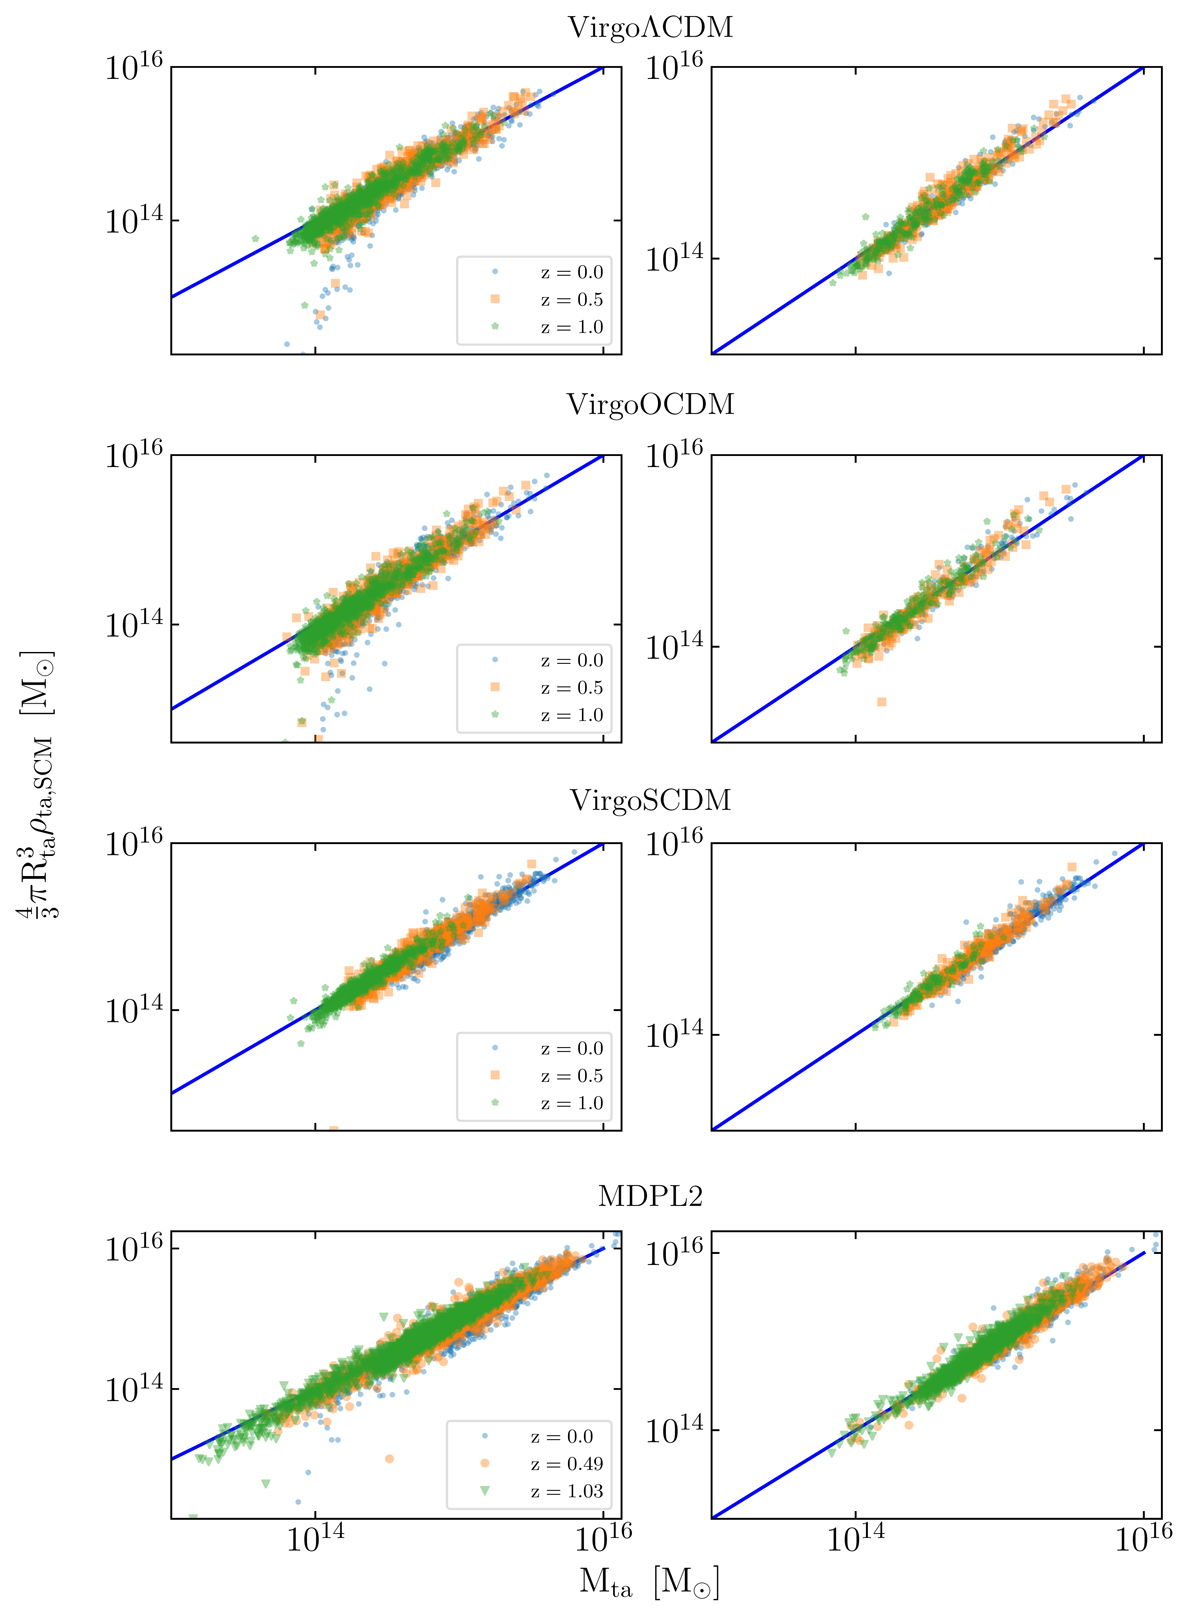
Fig. A.1.
Download original image
Correlation of the turnaround mass and turnaround radius. Different colors and symbols represent different redshifts. Different rows depict different simulated cosmologies, as in the titles. In order to have the same scale for different redshifts, the third power of the turnaround radius was multiplied by the spherical-collapse–predicted turnaround density for the given cosmology and redshift. The right panel in each row shows the least-aspherical subsample of the structures (α3D ≥ 0.6; see Sect. 3.2). The blue line represents the y = x line.
Current usage metrics show cumulative count of Article Views (full-text article views including HTML views, PDF and ePub downloads, according to the available data) and Abstracts Views on Vision4Press platform.
Data correspond to usage on the plateform after 2015. The current usage metrics is available 48-96 hours after online publication and is updated daily on week days.
Initial download of the metrics may take a while.