Open Access
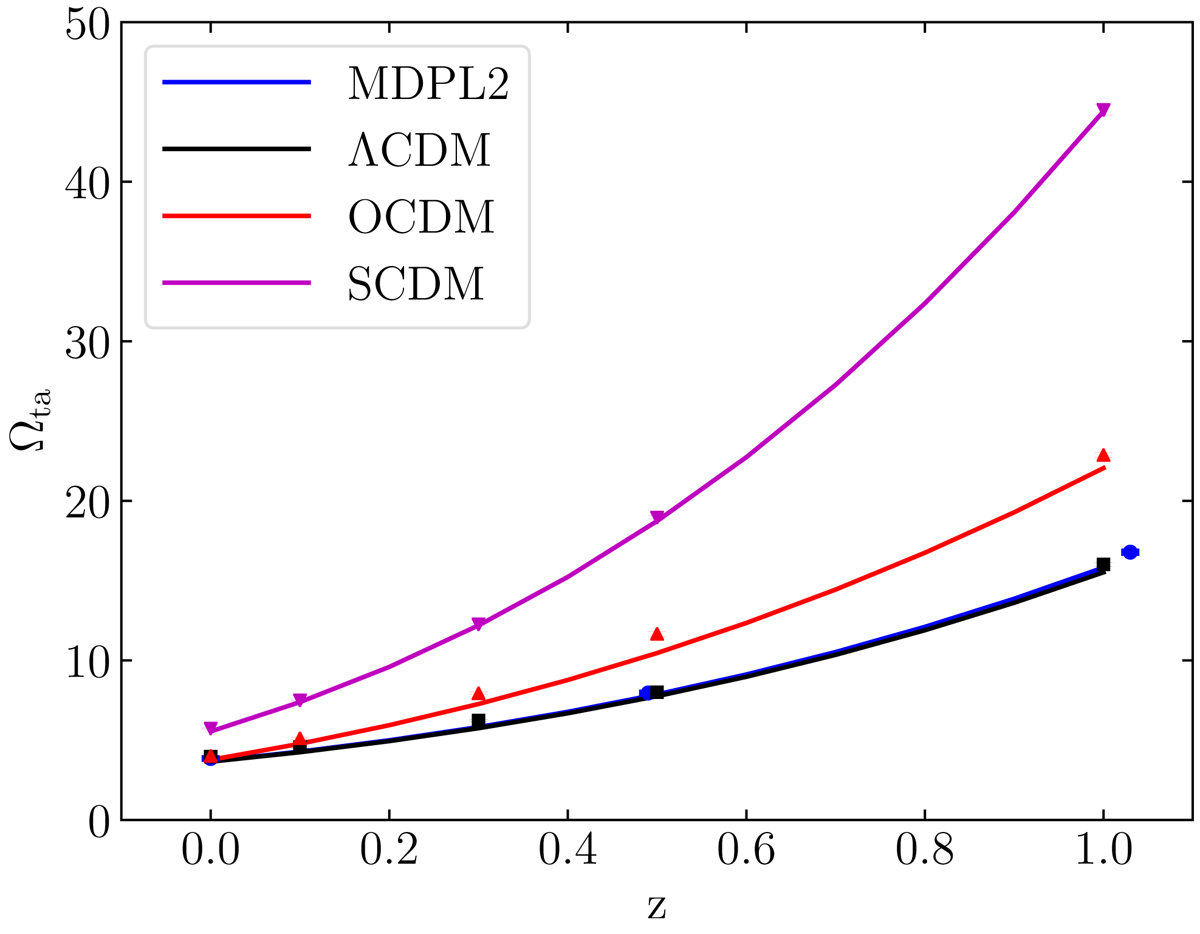
Fig. 3.
Download original image
As in the upper panel of Fig. 1, we plot the evolution Ωta with redshift and compare it to the prediction of the SCM for the Virgo simulations and for halos with α3D ≥ 0.5. With this cutoff, the offset between the points and solid lines is practically entirely eliminated.
Current usage metrics show cumulative count of Article Views (full-text article views including HTML views, PDF and ePub downloads, according to the available data) and Abstracts Views on Vision4Press platform.
Data correspond to usage on the plateform after 2015. The current usage metrics is available 48-96 hours after online publication and is updated daily on week days.
Initial download of the metrics may take a while.