Fig. 2.
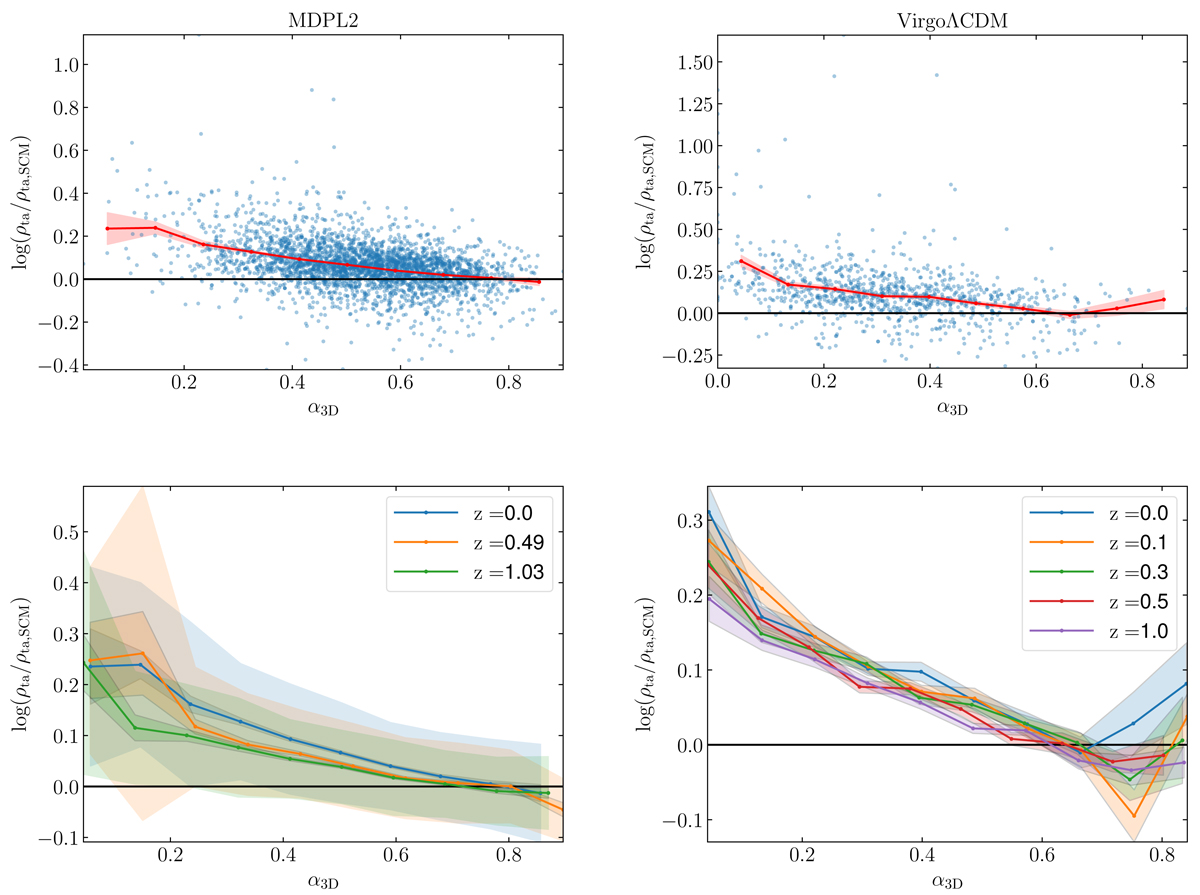
Download original image
Correlation between the turnaround density offset of a structure and the deviations of its neighbours from spherical symmetry. Upper panel: blue points show the turnaround density offset ρta/ρta,SCM as a function of the sphericity metric α3D (see text) for MDPL2 and Virgo ΛSCDM halos at a redshift z = 0. The two quantities are negatively correlated, as is confirmed by a Spearman test: very significant (very low p-value) moderate correlation, with a correlation coefficient of −0.42 and −0.39 for the two simulations, respectively. The red line shows the mean value of the offset in bins of α3D. The error in the y-axis depicts the standard error of the mean. The lower panel shows the same as the red points in the upper panel. Different colors represent different redshifts in MDPL2 and Virgo ΛSCDM. In the case of MDPL2 (left panel), we also included a low-tone shaded region showing the 1σ spread of points around the mean.
Current usage metrics show cumulative count of Article Views (full-text article views including HTML views, PDF and ePub downloads, according to the available data) and Abstracts Views on Vision4Press platform.
Data correspond to usage on the plateform after 2015. The current usage metrics is available 48-96 hours after online publication and is updated daily on week days.
Initial download of the metrics may take a while.