Fig. 5
Download original image
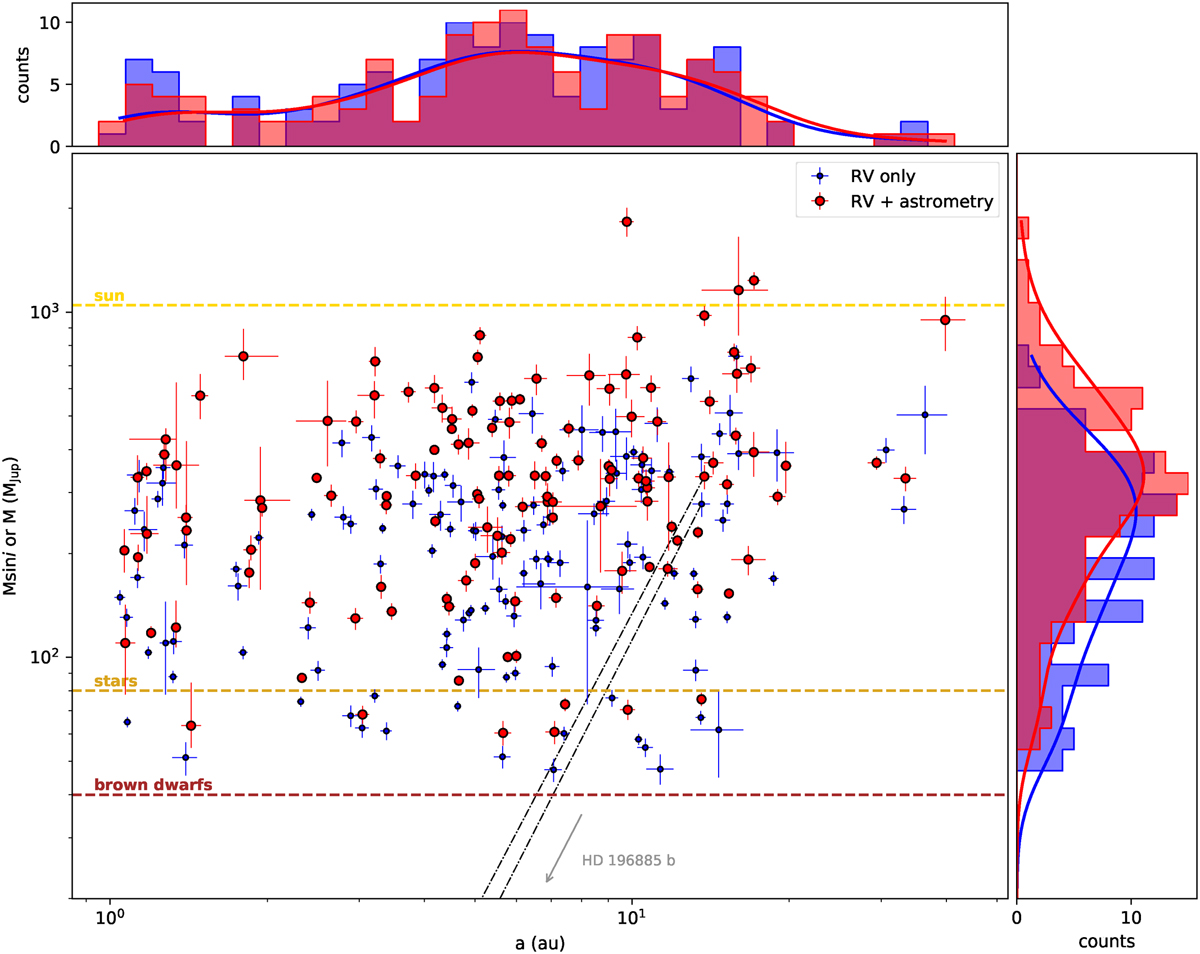
Comparison between the distributions in the M sin i-a parameter space of the M sin i > 40 MJup companions orbiting the 132 stars in the sample for which we performed simultaneous radial velocity and proper motion anomaly fits. The blue dots and histogram show the parameter space position and distribution of semimajor axes and minimum mass, respectively, as retrieved by the radial velocity analysis alone, while the respective red plot elements refer instead to the results of the simultaneous astrometry and radial velocity fits, and, therefore, true dynamical mass instead of minimum mass. The components of multiple systems are connected by gray dash-dotted lines, while the horizontal dashed brown, orange, and yellow lines respectively indicate the brown dwarf (40 MJup), dwarf star (80 MJup), and solar-mass (1047.58 MJup) thresholds.
Current usage metrics show cumulative count of Article Views (full-text article views including HTML views, PDF and ePub downloads, according to the available data) and Abstracts Views on Vision4Press platform.
Data correspond to usage on the plateform after 2015. The current usage metrics is available 48-96 hours after online publication and is updated daily on week days.
Initial download of the metrics may take a while.