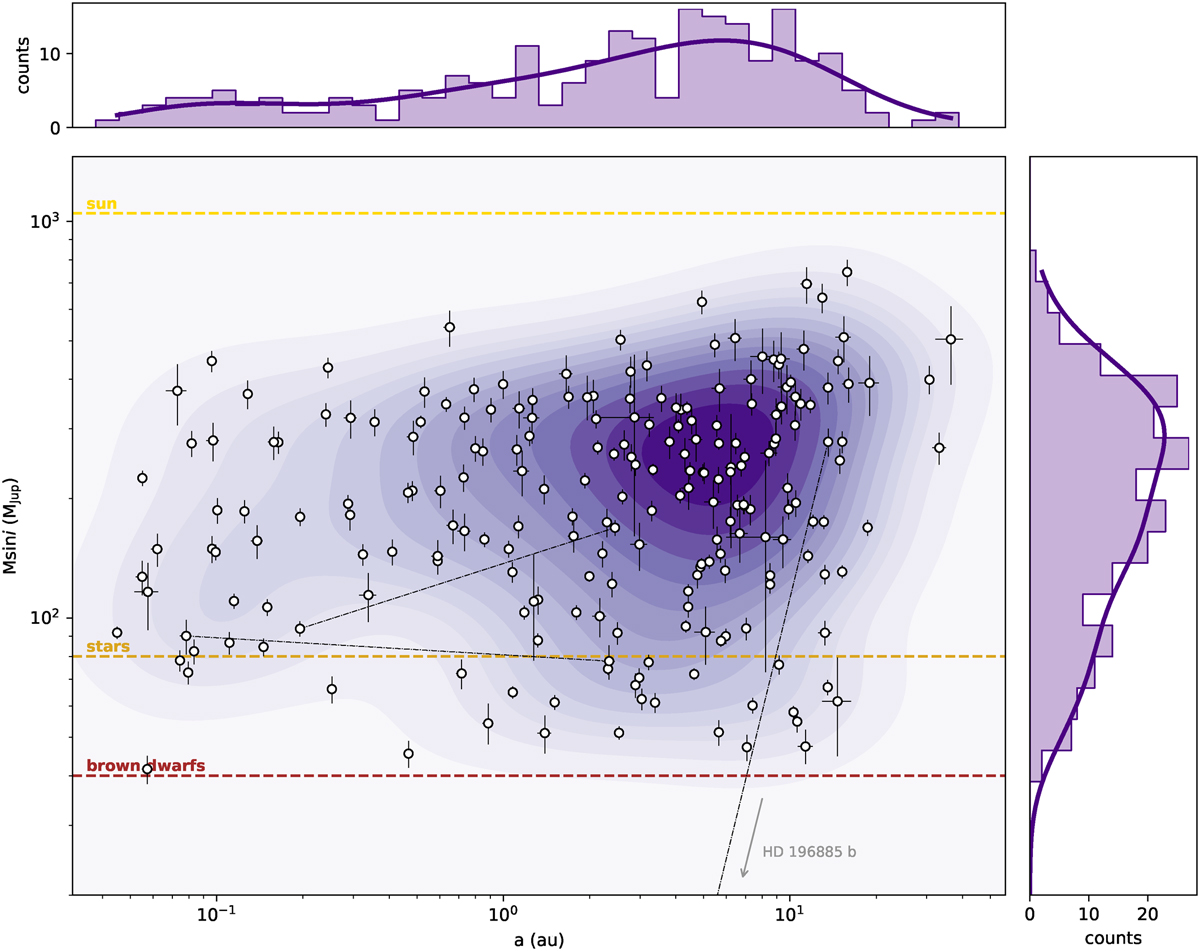
Fig. 3
Download original image
Distribution in the M sin i-a parameter space of the M sin i > 40 MJup companions identified in the sample and characterised via radial velocity analysis. In the main plot, the kernel density estimation of the population is plotted as contour levels, the components of multiple systems are connected by black dash-dotted lines, while the horizontal dashed brown, orange and yellow lines respectively indicate the brown dwarf (40 MJup), dwarf star (80 MJup), and solar-mass thresholds. The top-left and right-hand histograms show the distribution and kernel density estimation of the semimajor axes and minimum mass of the companions, respectively.
Current usage metrics show cumulative count of Article Views (full-text article views including HTML views, PDF and ePub downloads, according to the available data) and Abstracts Views on Vision4Press platform.
Data correspond to usage on the plateform after 2015. The current usage metrics is available 48-96 hours after online publication and is updated daily on week days.
Initial download of the metrics may take a while.