Fig. B.1
Download original image
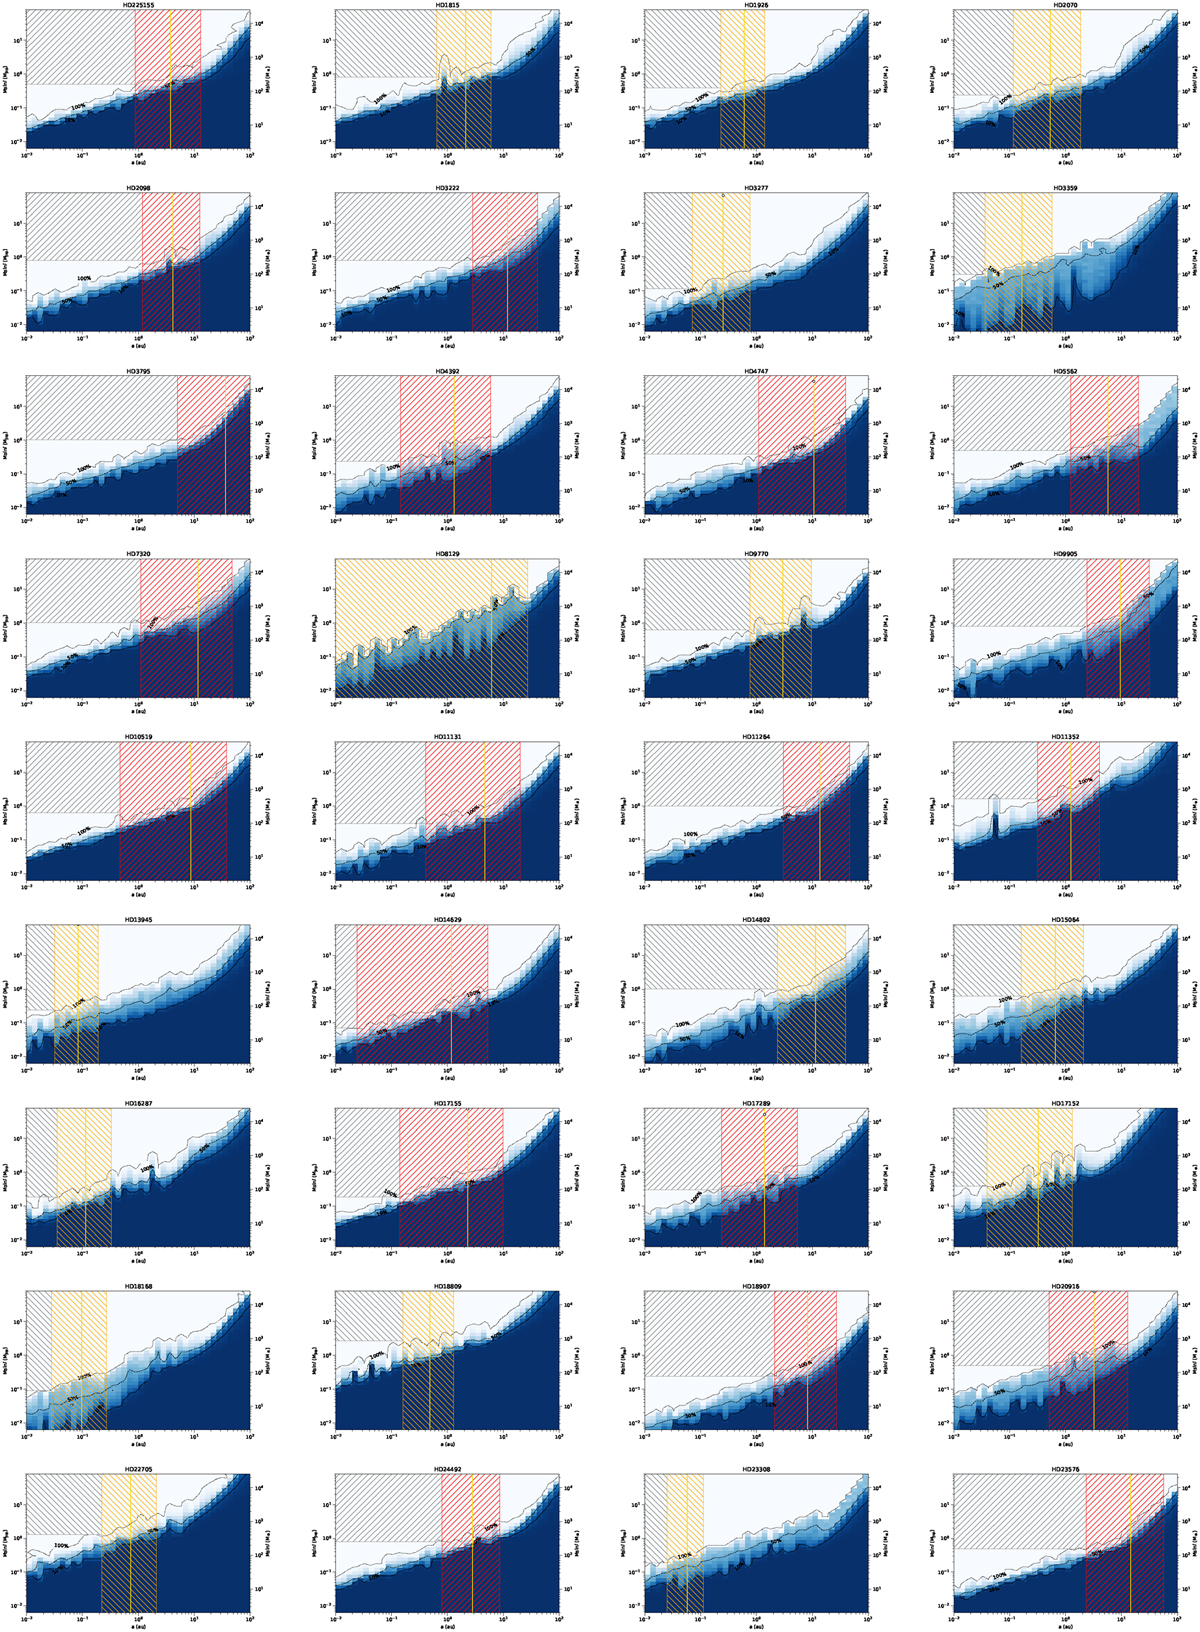
Completeness maps of each star in the binary sample, focused on the substellar (2 M⊕ <M sin i <80 MJup) companion regime. Detection frequency contour levels of 10, 50, and 100% are respectively shown as solid, dashed, and dotted curves, while the companions detected around each star are shown as white circles. In each plot, the hatched red and orange boxes represent the dynamically unstable semimajor axis range for additional substellar companions computed (respectively) using the true mass and minimum mass values of the detected companions in the sample, as described in Sect. 6.1. A vertical yellow line represents the detected companion semimajor axis. Hatched grey boxes show the region of parameter space for which we can exclude the presence of additional circumprimary companions based on the CORAVEL and CORALIE data analysed.
Current usage metrics show cumulative count of Article Views (full-text article views including HTML views, PDF and ePub downloads, according to the available data) and Abstracts Views on Vision4Press platform.
Data correspond to usage on the plateform after 2015. The current usage metrics is available 48-96 hours after online publication and is updated daily on week days.
Initial download of the metrics may take a while.