Open Access
Fig. 13
Download original image
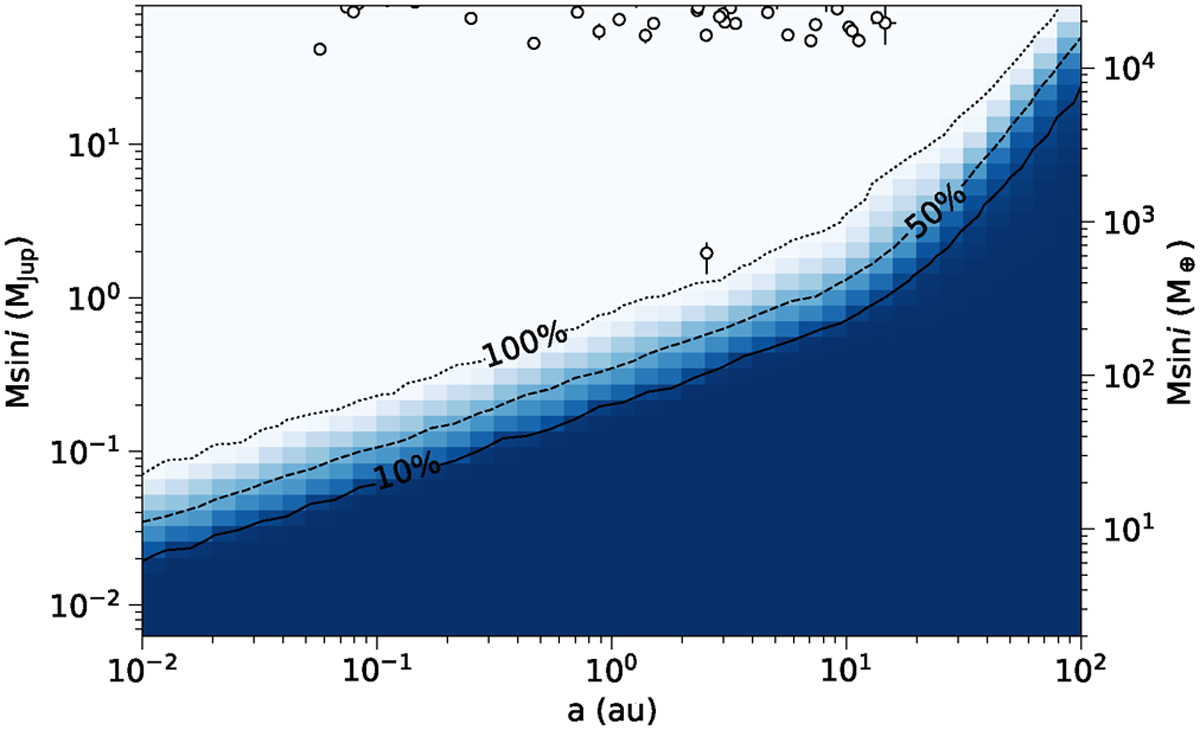
Completeness map of the binary sample, focused on the substellar (2 M⊕ < M sin i < 80 MJup) companion regime. Detection frequency contour levels of 10, 50, and 100% are shown as solid, dashed, and dotted curves, respectively, while the companions detected in our search are shown as white circles.
Current usage metrics show cumulative count of Article Views (full-text article views including HTML views, PDF and ePub downloads, according to the available data) and Abstracts Views on Vision4Press platform.
Data correspond to usage on the plateform after 2015. The current usage metrics is available 48-96 hours after online publication and is updated daily on week days.
Initial download of the metrics may take a while.