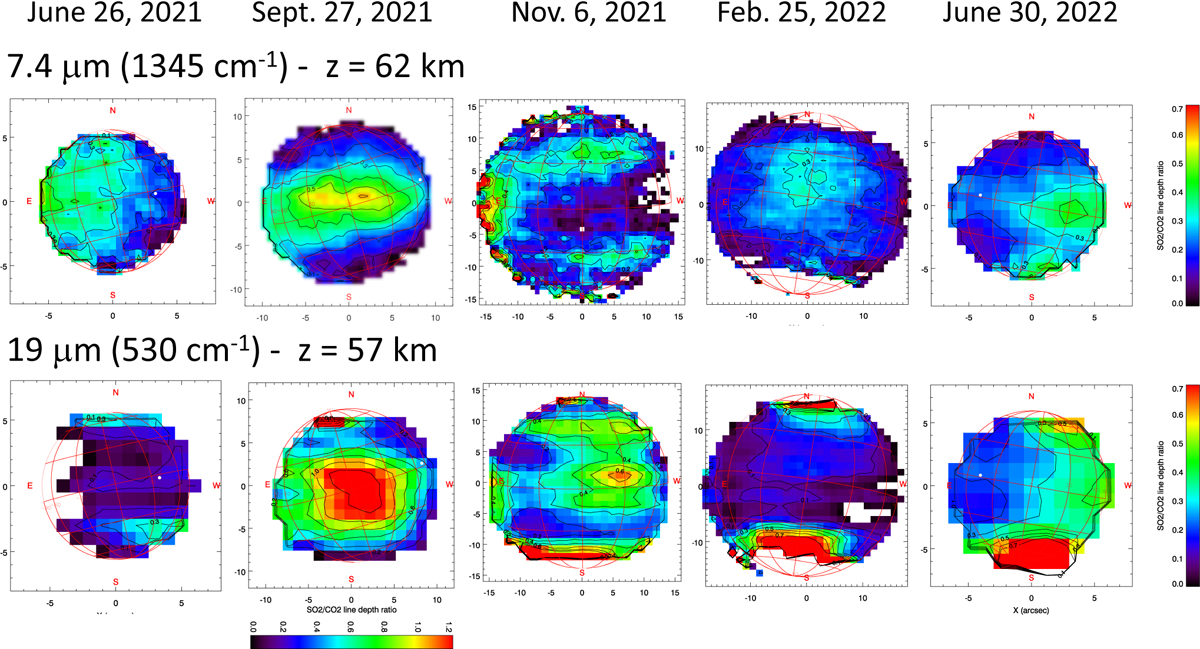
Fig. 9
Download original image
Examples of SO2 maps recorded in 2021–2022. Top: maps of the line depth ratio of a weak SO2 multiplet (around 1345.1 cm−1) to the CO2 transition at 1345.22 cm−1, recorded in 2021 and 2022 (one map per observing run). Disk-integrated spectra corresponding to these maps are shown in Fig 2. Bottom: maps of the line depth ratio of a weak SO2 multiplet (around 529.70 cm−1) to the CO2 transition at 529.81 cm−1, recorded in 2021 and 2022 (one map per observing run). For the 19 µm maps, the maximum scale is 0.7, except for September 2021 for which the maximum scale is 1.2, as indicated below the map. Disk-integrated spectra corresponding to these maps are shown in Fig. 3. The local maxima observed in 2022 near the south pole (bottom right) are instrumental artifacts, due to the nearly isothermal profile at high latitude, which prevents the SO2 retrieval.
Current usage metrics show cumulative count of Article Views (full-text article views including HTML views, PDF and ePub downloads, according to the available data) and Abstracts Views on Vision4Press platform.
Data correspond to usage on the plateform after 2015. The current usage metrics is available 48-96 hours after online publication and is updated daily on week days.
Initial download of the metrics may take a while.