Fig. 13
Download original image
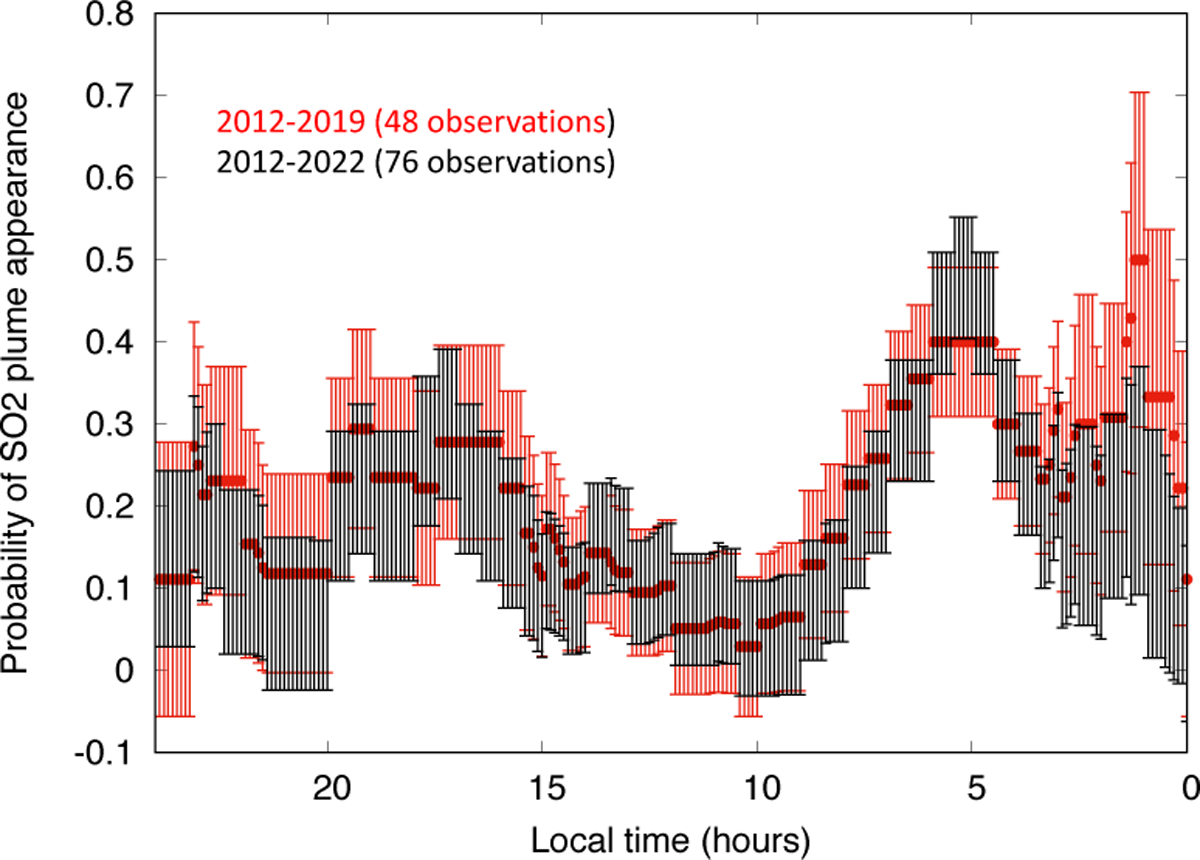
Probability of SO2 appearance as a function of local time, using the whole 2012–2022 dataset (black points). The error bar is proportional to n−0.5, where n is the number of observations for which the local time is observed. Red points: dataset without the 2020–2021 data, as shown in Fig. 14 of E20. The local hour scale increases from right to left, corresponding to the orientation on the Venus disk as seen by an external observer.
Current usage metrics show cumulative count of Article Views (full-text article views including HTML views, PDF and ePub downloads, according to the available data) and Abstracts Views on Vision4Press platform.
Data correspond to usage on the plateform after 2015. The current usage metrics is available 48-96 hours after online publication and is updated daily on week days.
Initial download of the metrics may take a while.