Fig. 10
Download original image
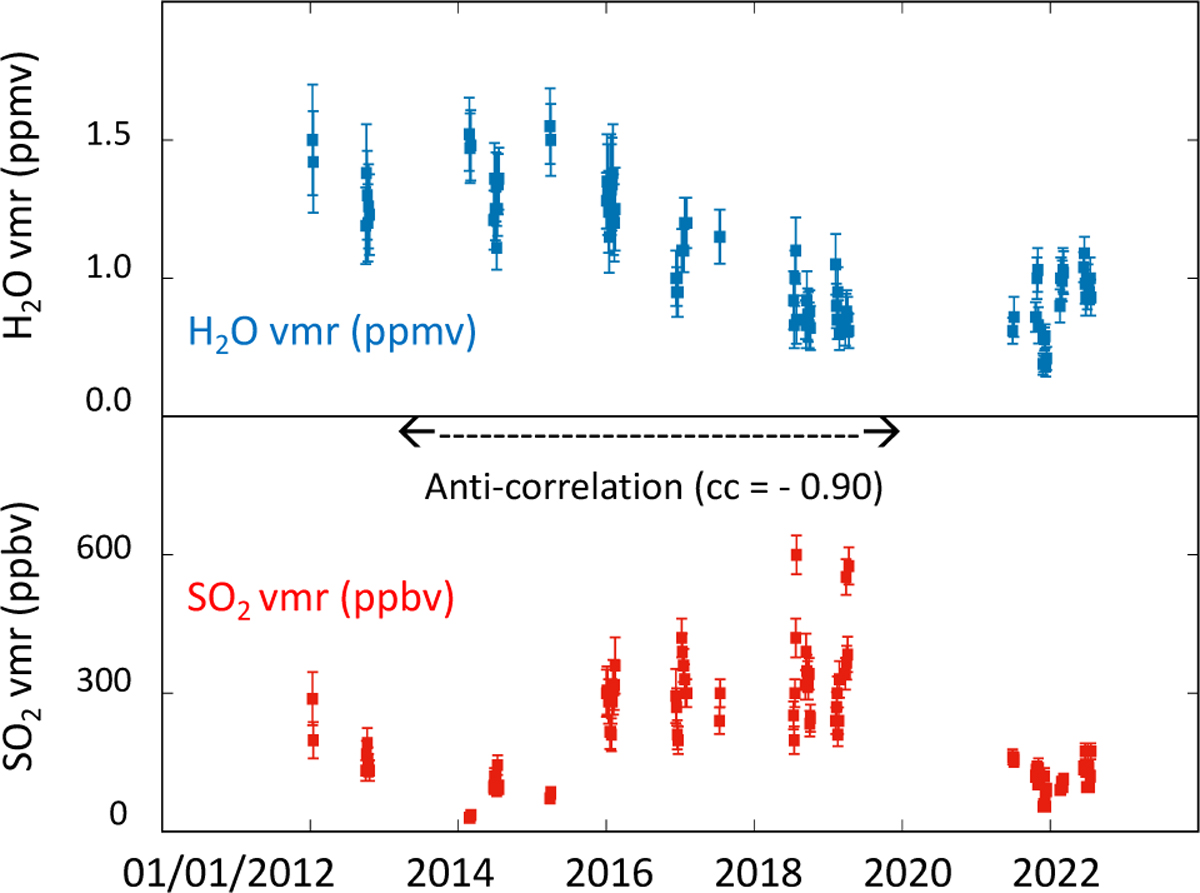
Comparative long-term temporal evolution of H2O and SO2 at the Venus cloud top. Top: long-term variations in the H2O vmr (blue points), inferred from the HDO measurements at the cloud top from the TEXES data at 7.4 µm. Bottom: long-term variations in the SO2 vmr inferred at the cloud top (7.4 µm, red points). A daily value is shown in this figure.
Current usage metrics show cumulative count of Article Views (full-text article views including HTML views, PDF and ePub downloads, according to the available data) and Abstracts Views on Vision4Press platform.
Data correspond to usage on the plateform after 2015. The current usage metrics is available 48-96 hours after online publication and is updated daily on week days.
Initial download of the metrics may take a while.