Fig. 9
Download original image
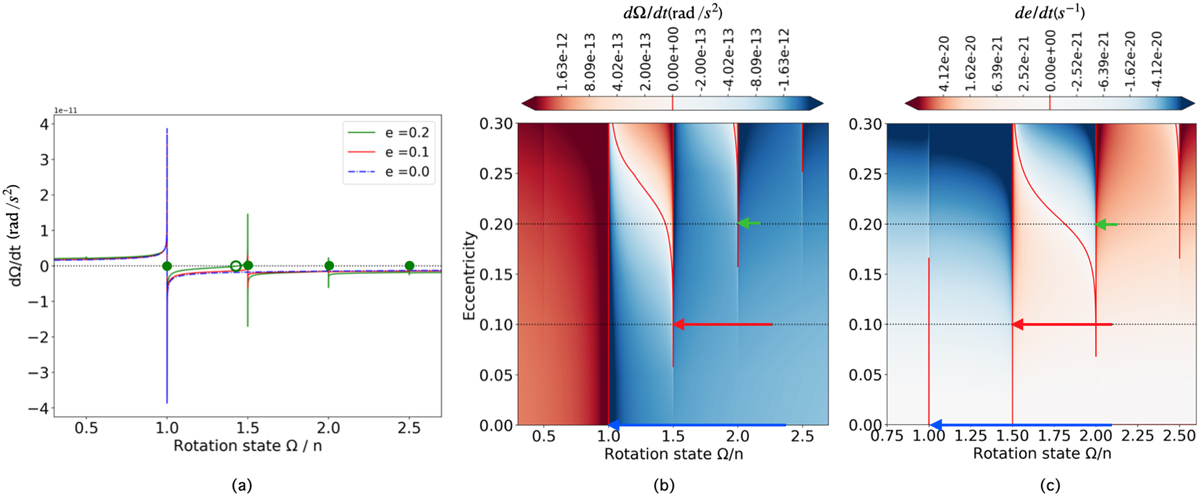
Spin derivative dΩ/dt(rad s−2). The left panel shows the spin derivative as a function of the rotation state Ω/n (Ω and n are the spin and mean motion, respectively), for different eccentricities. The green dots (filled and empty) represent the equilibrium states, stable (i.e., SORs) and unstable, respectively. The middle and right panels represent the spin derivative and the eccentricity derivative as a function of the rotation state Ω/n and the eccentricity, respectively. The red colored areas depict the positives values, the blue areas depict the negative values, and the red line corresponds to dΩ./dt = 0. The dotted lines represent the two eccentric cases in the left panel (e = 0.1 and e = 0.2). The arrows represent the evolutions presented in Fig. 8.
Current usage metrics show cumulative count of Article Views (full-text article views including HTML views, PDF and ePub downloads, according to the available data) and Abstracts Views on Vision4Press platform.
Data correspond to usage on the plateform after 2015. The current usage metrics is available 48-96 hours after online publication and is updated daily on week days.
Initial download of the metrics may take a while.