Fig. 7
Download original image
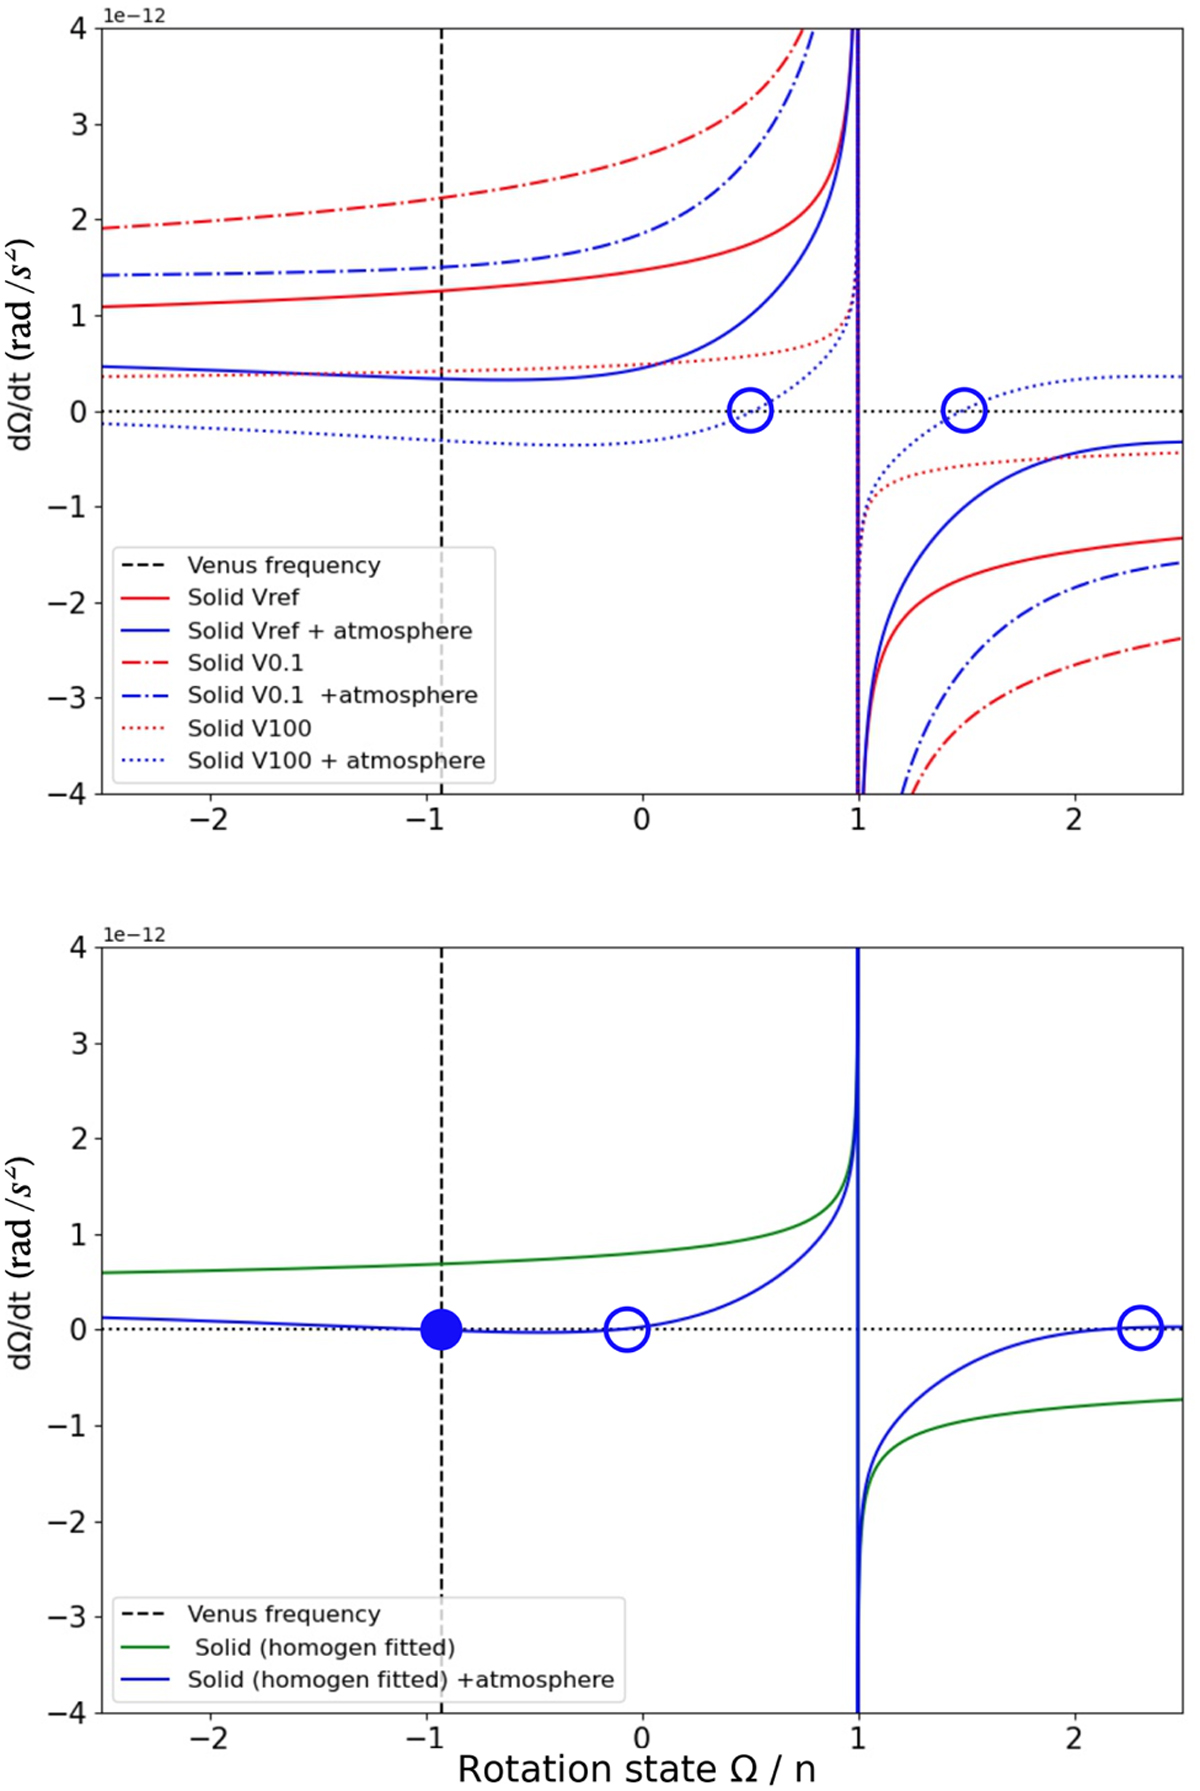
Spin derivative as a function of the rotation (in terms of Ω/n, Ω and n the planetary spin and mean motion respectively). In the top panel, the red lines correspond to the solid tides, and the blue lines correspond to the cases with solid and atmospheric tides. The solid lines correspond to the reference multilayer profile Vref. The dotted and dash-dotted lines correspond to the V0.1 and V100 profiles, respectively. In the bottom panel, the green line represents the solid tides associated with the homogeneous body (see Sect. 2.2 for details). The blue line corresponds to the cases with the contribution of atmospheric tides. The vertical dashed black line represents the current frequency of Venus in both panels. The dots (filled and empty) represent the equilibrium states between the gravitational and thermal tides (stable and unstable, respectively).
Current usage metrics show cumulative count of Article Views (full-text article views including HTML views, PDF and ePub downloads, according to the available data) and Abstracts Views on Vision4Press platform.
Data correspond to usage on the plateform after 2015. The current usage metrics is available 48-96 hours after online publication and is updated daily on week days.
Initial download of the metrics may take a while.