Fig. 6
Download original image
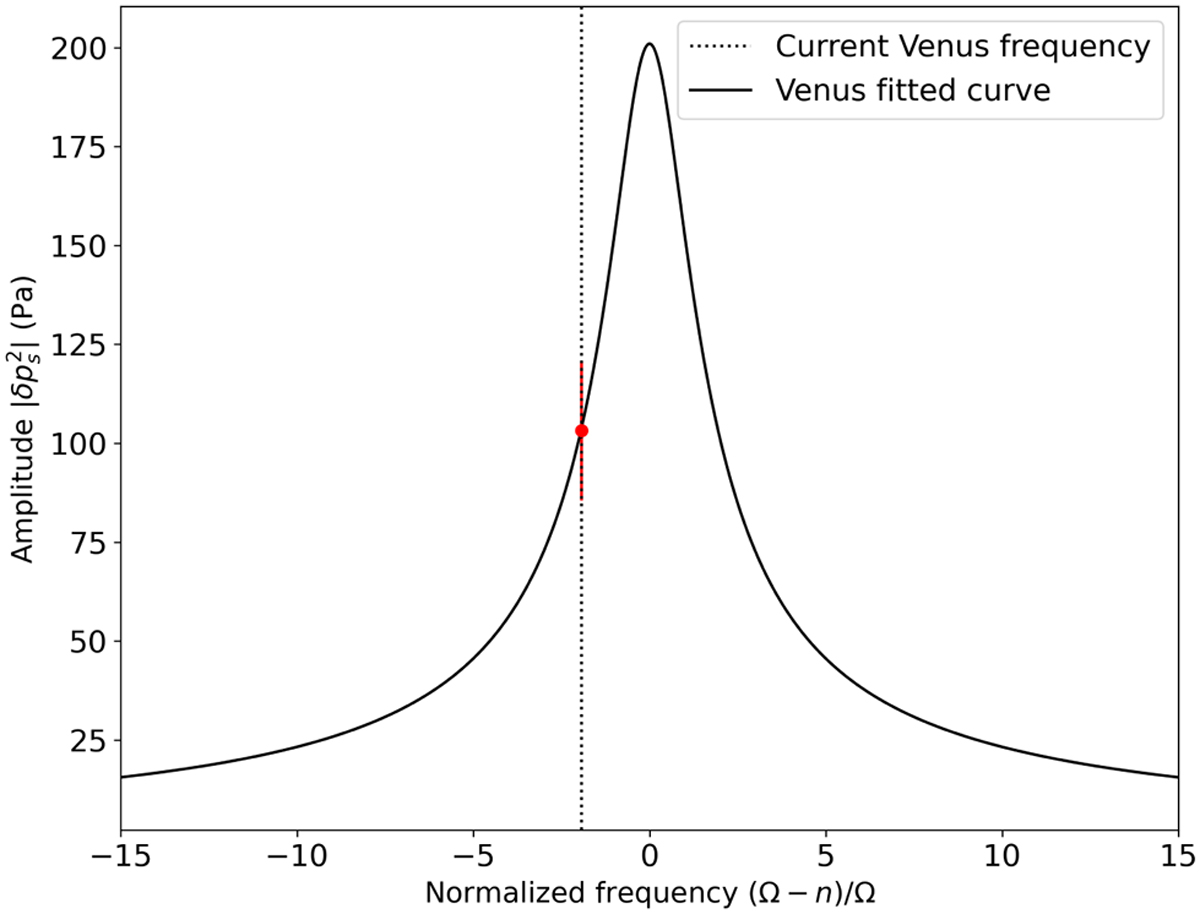
Amplitude of the pressure bulge ![]() as a function of the normalized forcing frequency (Ω − n)/Ω. The solid line represents the analytical solution fit for the point of Venus (red dot) computed with Venus GCM simulations (see Leconte et al. 2015). The red bars on the Venus point are not strictly error bars. They represent the dispersion of the pressure bulge at the surface.
as a function of the normalized forcing frequency (Ω − n)/Ω. The solid line represents the analytical solution fit for the point of Venus (red dot) computed with Venus GCM simulations (see Leconte et al. 2015). The red bars on the Venus point are not strictly error bars. They represent the dispersion of the pressure bulge at the surface.
Current usage metrics show cumulative count of Article Views (full-text article views including HTML views, PDF and ePub downloads, according to the available data) and Abstracts Views on Vision4Press platform.
Data correspond to usage on the plateform after 2015. The current usage metrics is available 48-96 hours after online publication and is updated daily on week days.
Initial download of the metrics may take a while.