Fig. 5
Download original image
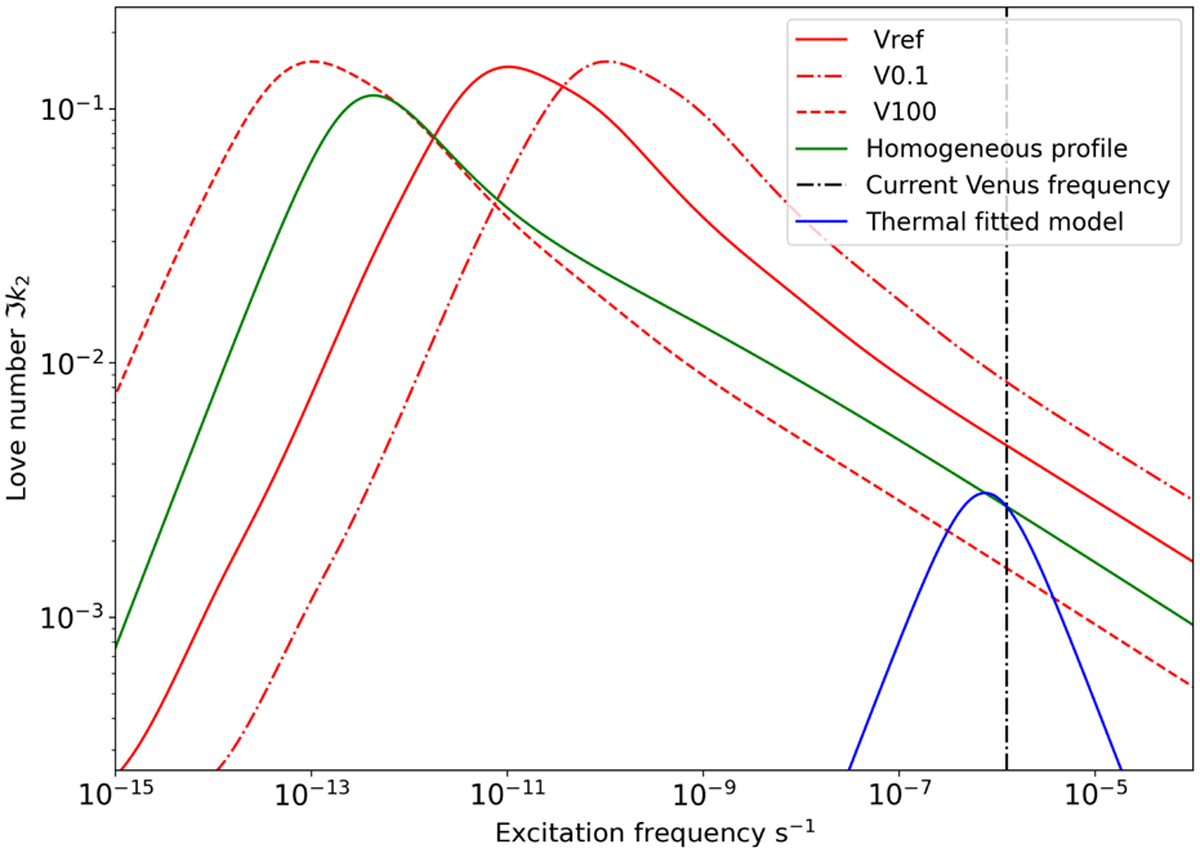
Imaginary part of the gravitational Love number ![]() as a function of the excitation frequency of a Venus-like planet for different viscosity profiles. The multilayer reference profile Vreſ derived from Armann & Tackley (2012) is shown as the solid red line. The dotted and dash-dotted red lines represent the V0.1 and V100 profiles derived from the multilayer reference one presented in Fig. 4. In blue we present the imaginary Love number
as a function of the excitation frequency of a Venus-like planet for different viscosity profiles. The multilayer reference profile Vreſ derived from Armann & Tackley (2012) is shown as the solid red line. The dotted and dash-dotted red lines represent the V0.1 and V100 profiles derived from the multilayer reference one presented in Fig. 4. In blue we present the imaginary Love number ![]() as a function of the excitation frequency computed with Eq. (12), (in absolute values) associated with the amplitude of the thermal tides presented in Fig. 6. The green curve represents the homogeneous profile described in Sect. 2.4. The vertical dotted black line represents the absolute value of the current frequency state of Venus.
as a function of the excitation frequency computed with Eq. (12), (in absolute values) associated with the amplitude of the thermal tides presented in Fig. 6. The green curve represents the homogeneous profile described in Sect. 2.4. The vertical dotted black line represents the absolute value of the current frequency state of Venus.
Current usage metrics show cumulative count of Article Views (full-text article views including HTML views, PDF and ePub downloads, according to the available data) and Abstracts Views on Vision4Press platform.
Data correspond to usage on the plateform after 2015. The current usage metrics is available 48-96 hours after online publication and is updated daily on week days.
Initial download of the metrics may take a while.