Fig. 15
Download original image
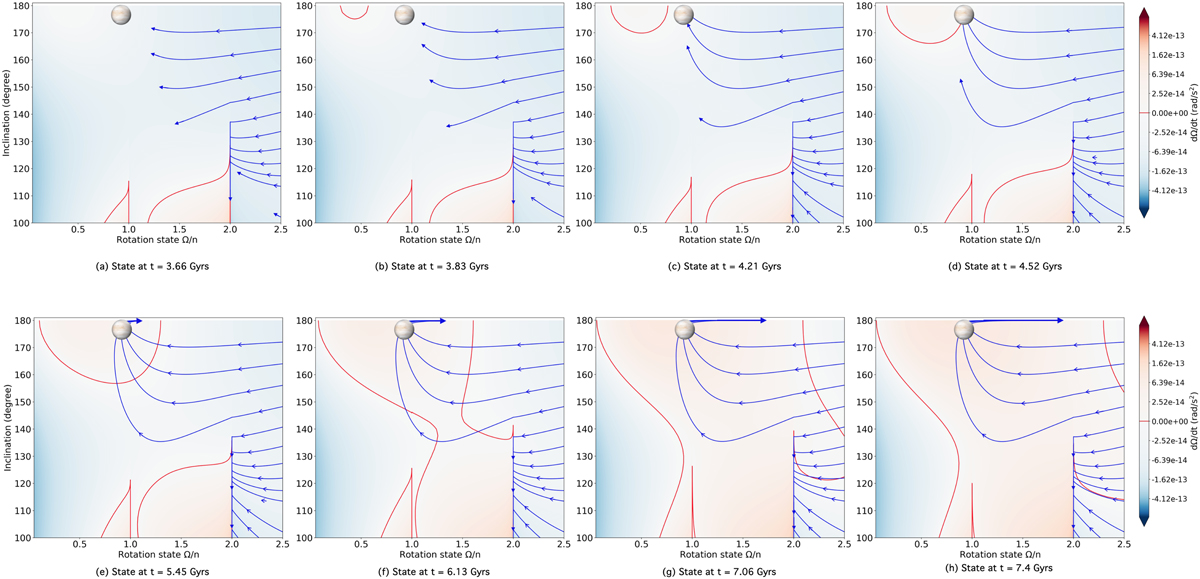
Same as Fig. 13b for a variable luminosity. Each panel shows the derivation map and ESPEM simulation paths at different time steps. The image of Venus at the top of the plots correspond to the current spin state of Venus. The blue curves correspond to ESPEM simulations evolving with time and luminosity as described in Sect. 4.2.
Current usage metrics show cumulative count of Article Views (full-text article views including HTML views, PDF and ePub downloads, according to the available data) and Abstracts Views on Vision4Press platform.
Data correspond to usage on the plateform after 2015. The current usage metrics is available 48-96 hours after online publication and is updated daily on week days.
Initial download of the metrics may take a while.