Open Access
Fig. 14
Download original image
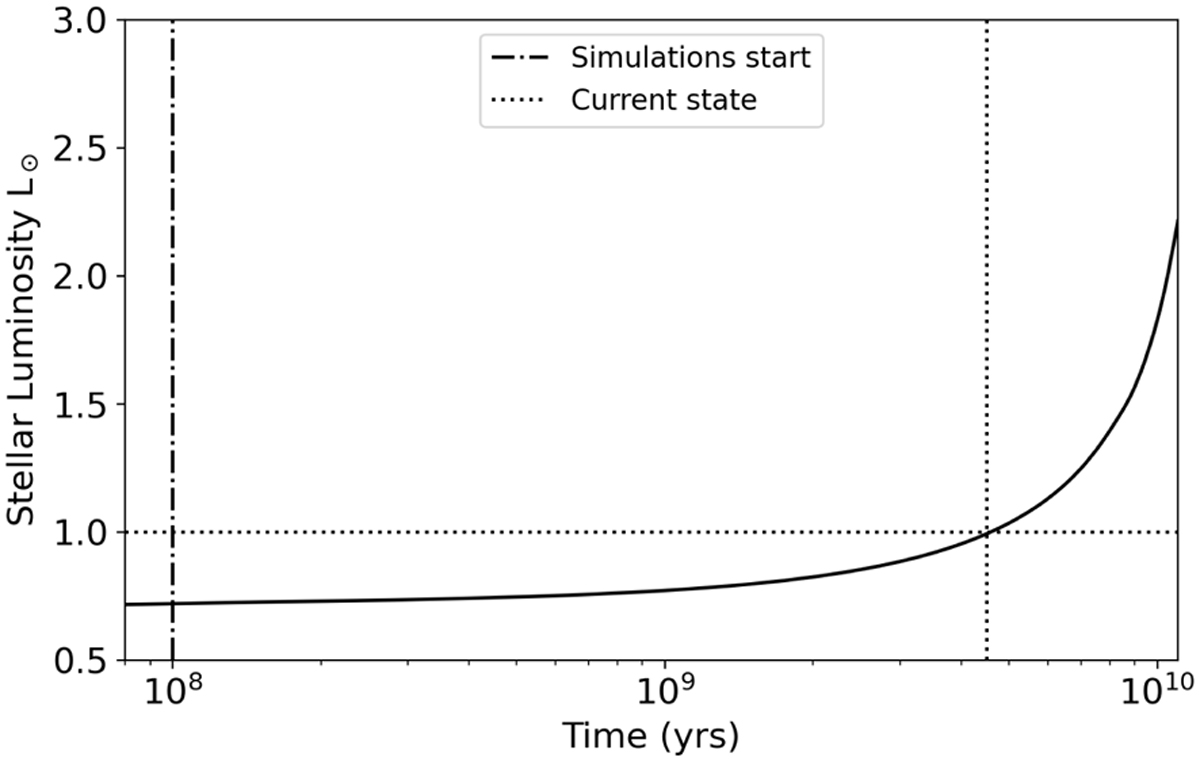
Luminosity variation of a Sun-like star over the time from the beginning to the end of the MS. The dash-dotted line represents the simulation start time. The dotted lines represent the current time state.
Current usage metrics show cumulative count of Article Views (full-text article views including HTML views, PDF and ePub downloads, according to the available data) and Abstracts Views on Vision4Press platform.
Data correspond to usage on the plateform after 2015. The current usage metrics is available 48-96 hours after online publication and is updated daily on week days.
Initial download of the metrics may take a while.