Fig. 13
Download original image
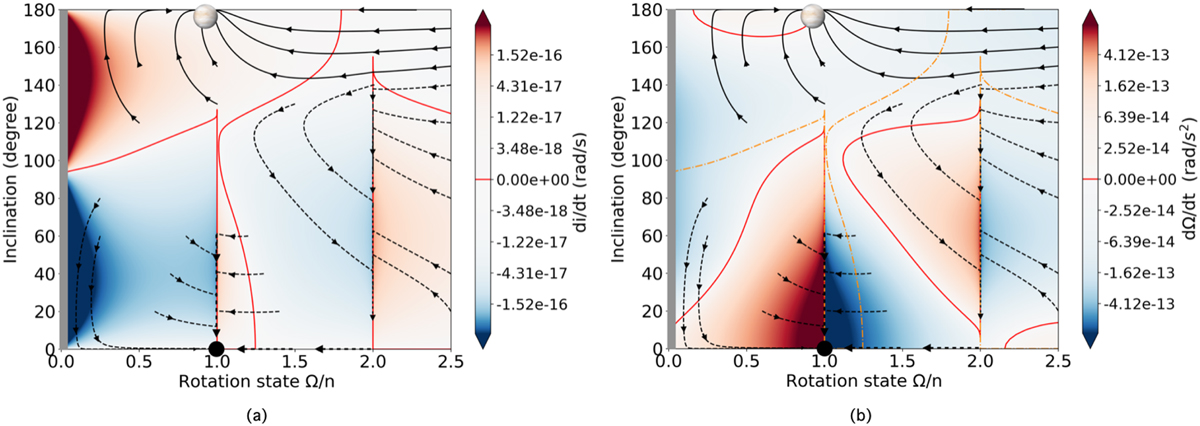
Panel a: inclination derivative di/dt (in rad/s) as a function of the spin Ω/n (Ω and n are the planetary spin and mean motion respectively) and for different inclinations (from 0 to 180 degrees). Panel b: spin derivative dΩ/dt (in rad/s2) as a function of the spin Ω/n and inclinations (from 0 to 180 degrees). The red lines represent the null derivative in both panels. The arrows show the evolution of the system. They are consistent with the sign of the inclination derivative (panel a) and the spin derivative (panel b). The dotted orange lines represent the null points of the inclination derivative from the panel a (in red in the panel a). The image of Venus at the top of the two panels corresponds to the current state of Venus. The black dot represents the 1:1 synchronization state. The gray area hides the part of the plots close to the null rotation.
Current usage metrics show cumulative count of Article Views (full-text article views including HTML views, PDF and ePub downloads, according to the available data) and Abstracts Views on Vision4Press platform.
Data correspond to usage on the plateform after 2015. The current usage metrics is available 48-96 hours after online publication and is updated daily on week days.
Initial download of the metrics may take a while.