Fig. 11
Download original image
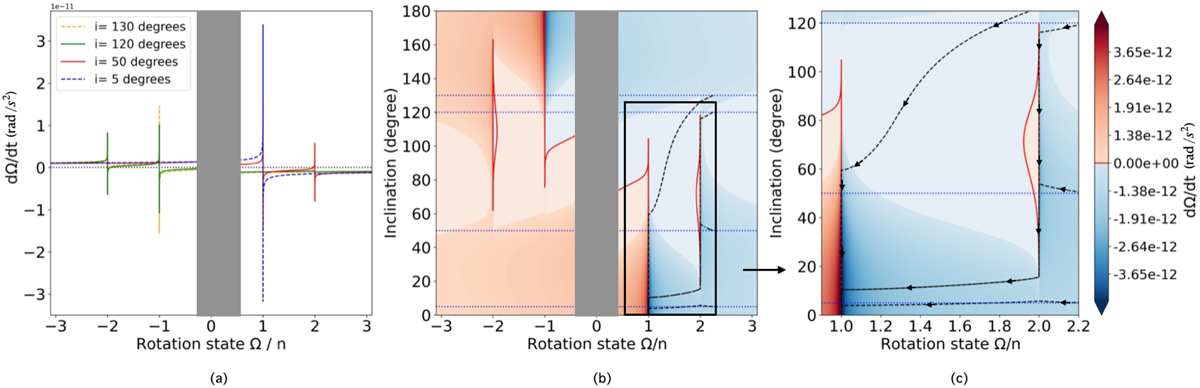
Spin derivative dΩ/dt (in rad s−2). The left panel shows the spin derivative as a function of the rotation state Ω/n and for different inclinations (5, 50, 120, and 130 degrees). The middle panel represents the value of the spin derivative as a function of Ω/n and the inclination. The red areas depict the positives values, and the blue areas depict the negative values. The dotted black lines of the middle and right panels represent the four inclination values (5, 50, 120, and 130 degrees) plotted in the left panel. The right panel shows a zoom into the square drawn in the middle panel, centered on the 2 : 1 SOR. The dashed black curves depict the paths of the simulations presented in Fig. 10. The gray areas hide the part of the figure close to the null rotation, where the equations used are no longer valid due to the gyroscopic approximation (see Sect. 2.5).
Current usage metrics show cumulative count of Article Views (full-text article views including HTML views, PDF and ePub downloads, according to the available data) and Abstracts Views on Vision4Press platform.
Data correspond to usage on the plateform after 2015. The current usage metrics is available 48-96 hours after online publication and is updated daily on week days.
Initial download of the metrics may take a while.