Open Access
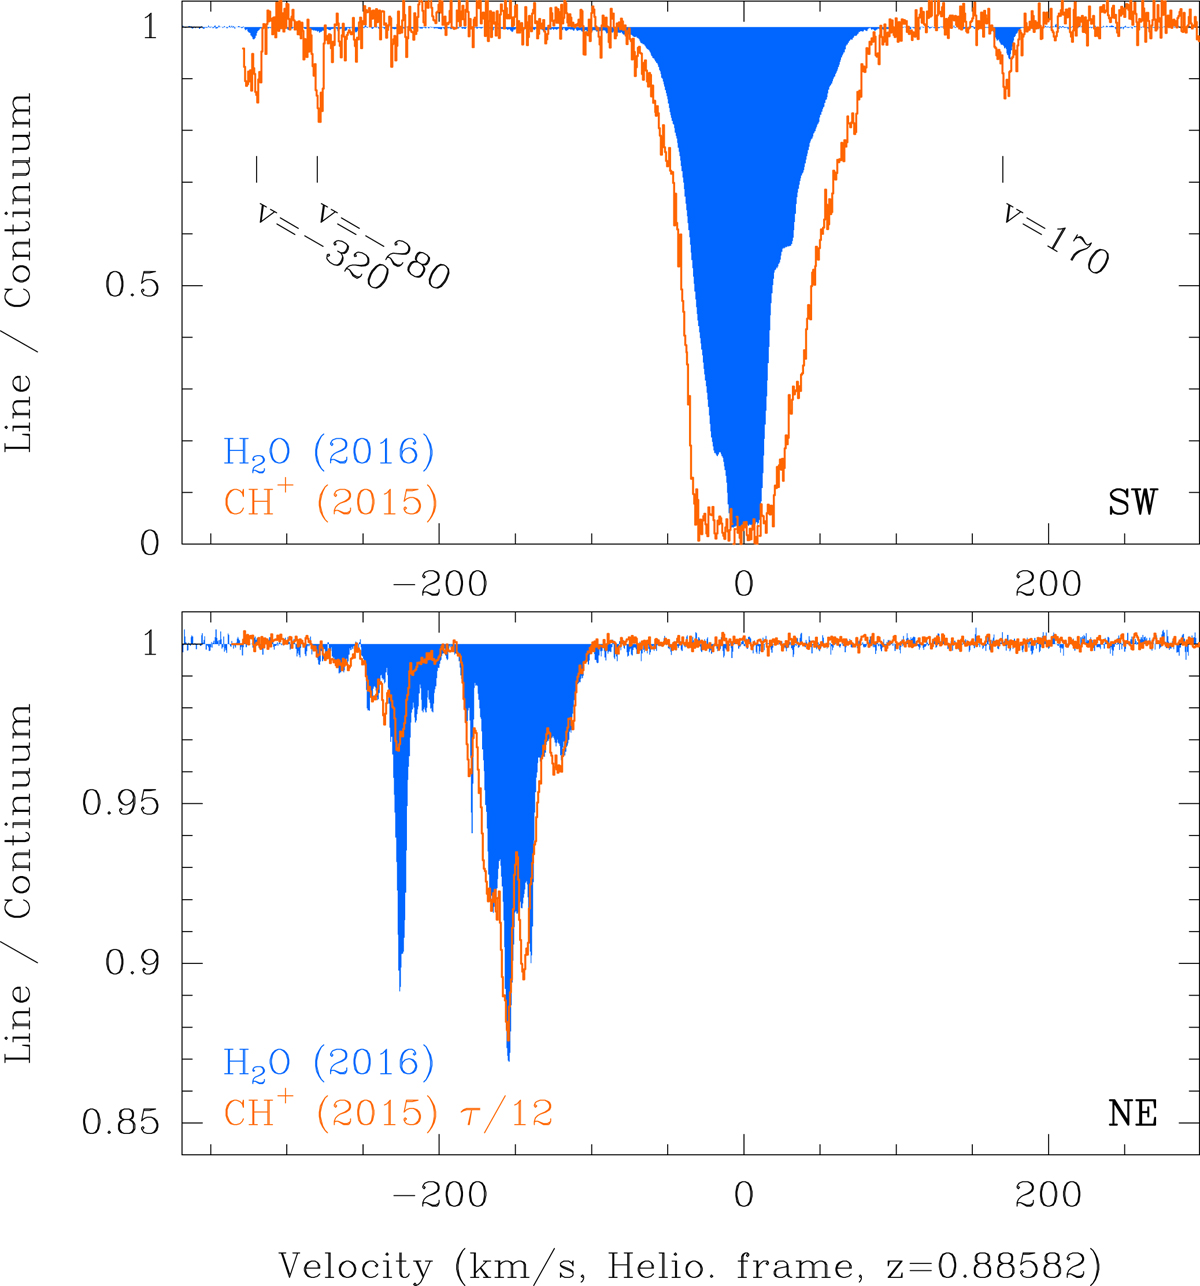
Fig. 8.
Download original image
Comparison of the average H2O spectrum (filled blue) observed in 2016 with the ALMA CH+ (1−0) spectrum (orange line) observed in 2015 (Muller et al. 2017) for both lines of sight. For the NE spectrum, the opacity of the CH+ line, assuming a filling factor of unity, is reduced by a factor 12.
Current usage metrics show cumulative count of Article Views (full-text article views including HTML views, PDF and ePub downloads, according to the available data) and Abstracts Views on Vision4Press platform.
Data correspond to usage on the plateform after 2015. The current usage metrics is available 48-96 hours after online publication and is updated daily on week days.
Initial download of the metrics may take a while.