Open Access
Fig. 7.
Download original image
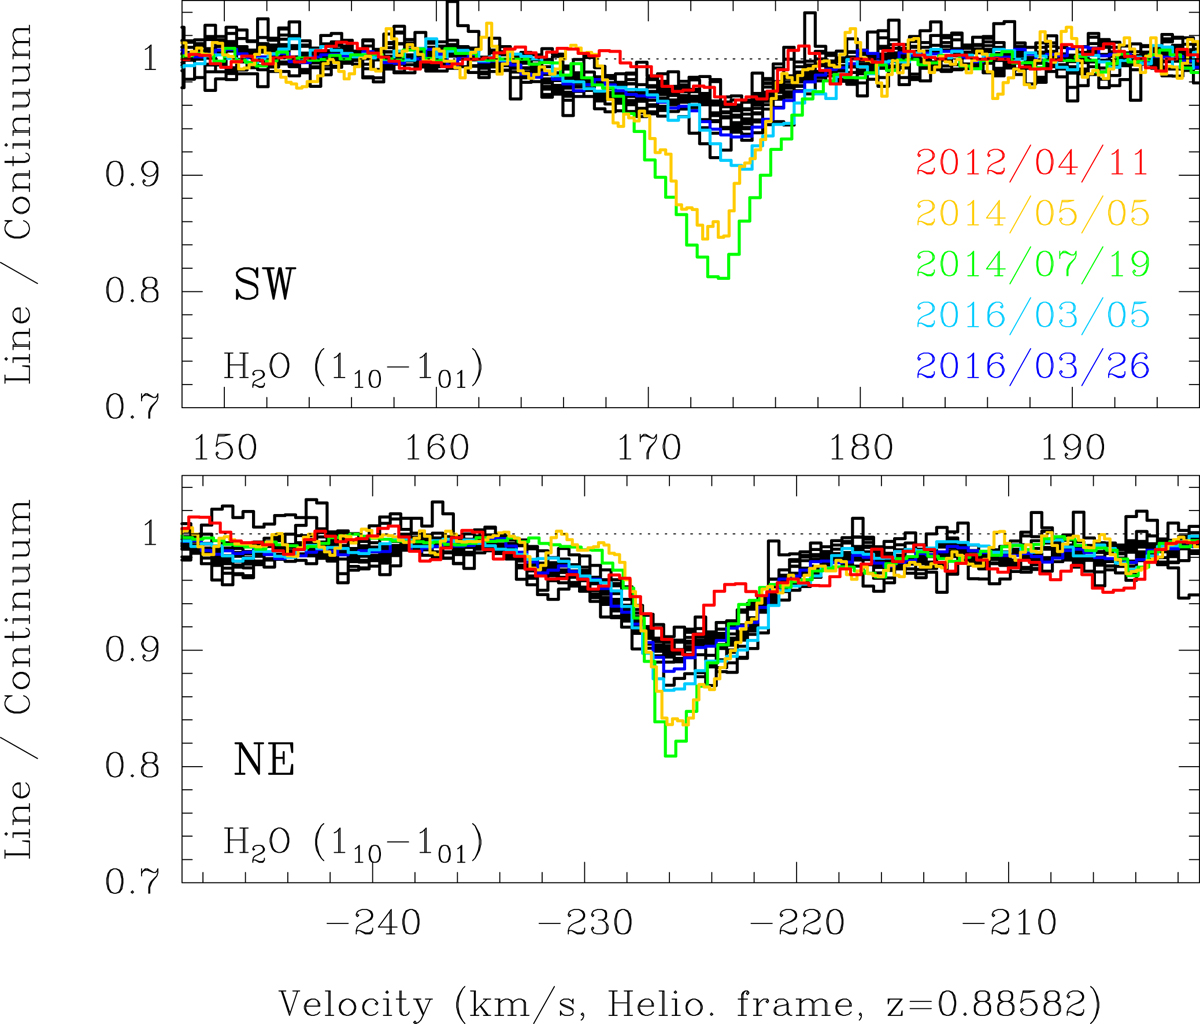
Zoom onto the variations of the +174 km s−1 (top) and −225 km s−1 (bottom) features in the H2O SW and NE spectra, respectively. Same as for Fig. 6; special profiles showing clear deviations are highlighted with the color code given in the upper box.
Current usage metrics show cumulative count of Article Views (full-text article views including HTML views, PDF and ePub downloads, according to the available data) and Abstracts Views on Vision4Press platform.
Data correspond to usage on the plateform after 2015. The current usage metrics is available 48-96 hours after online publication and is updated daily on week days.
Initial download of the metrics may take a while.