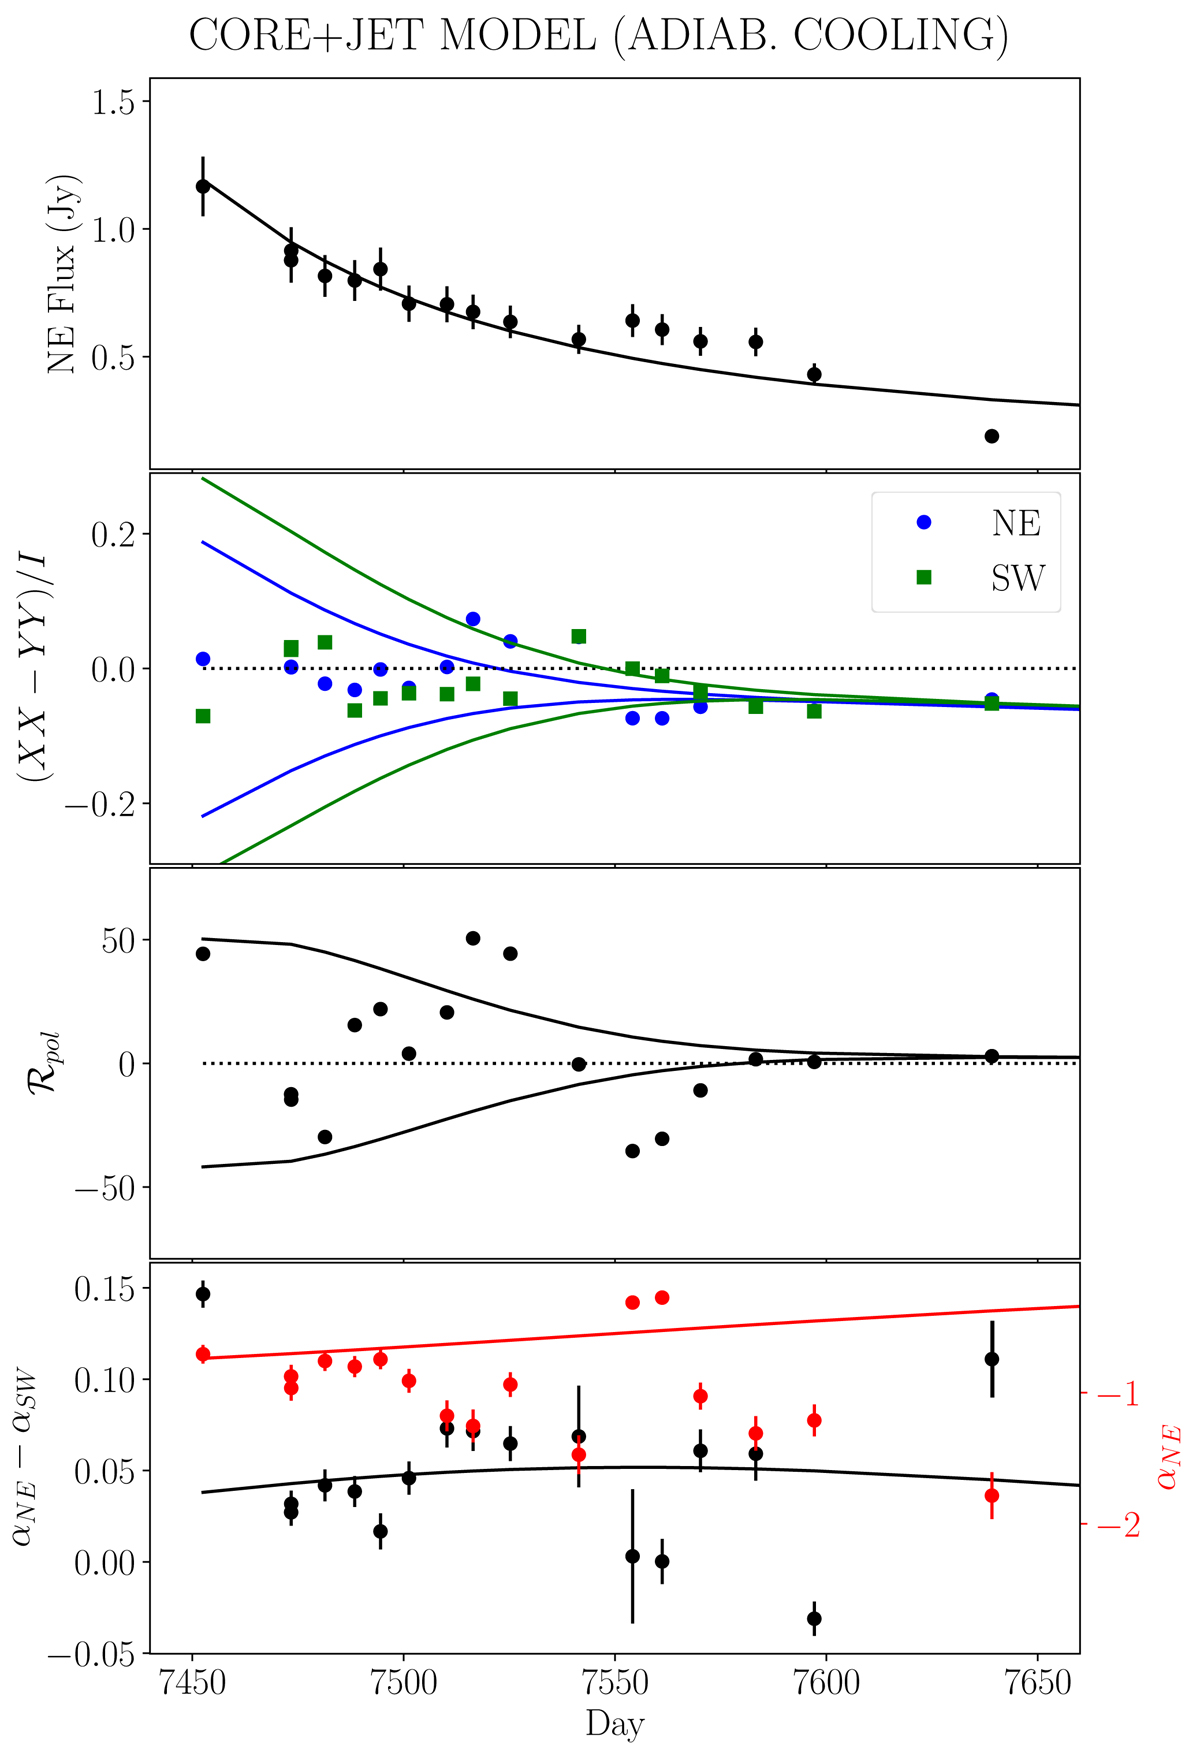
Fig. 4.
Download original image
Fit of the light curve, spectral index, and spectral-index difference between the NE and SW images using the parametric model provided by Eqs. (3) and (5). The envelope of extreme model values for the differential polarization quantities is plotted against measurements using the model extension described in Sect. 3.7. The fit also provides the spectral index of the NE image (red points).
Current usage metrics show cumulative count of Article Views (full-text article views including HTML views, PDF and ePub downloads, according to the available data) and Abstracts Views on Vision4Press platform.
Data correspond to usage on the plateform after 2015. The current usage metrics is available 48-96 hours after online publication and is updated daily on week days.
Initial download of the metrics may take a while.