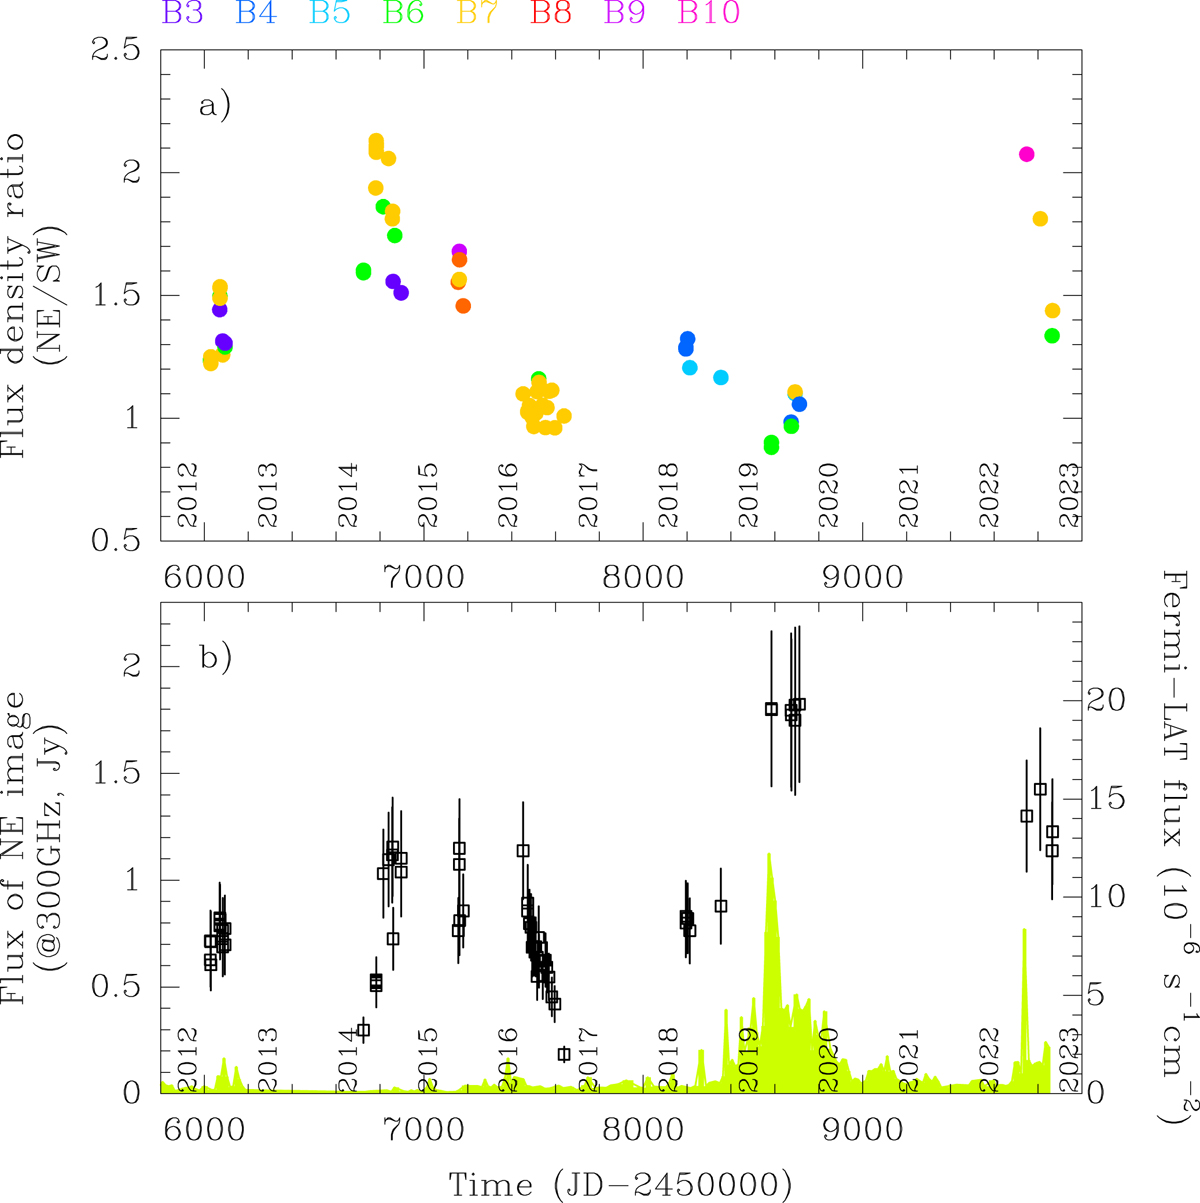
Fig. 2.
Download original image
History of ALMA measurements toward PKS 1830−211. (a) Flux-density ratios of PKS 1830−211 NE and SW images (with the color code corresponding to ALMA bands, as indicated at the top of the figure). (b) Flux densities of the NE image of PKS 1830−211, scaled to an equivalent frequency of 300 GHz such as S300 GHz = Sν × (ν/300 GHz)α with a spectral index α = −0.7 (error bars indicate a nominal flux uncertainty of 20%) overlaid on top of the Fermi-LAT γ-ray daily-monitoring light curve (in green).
Current usage metrics show cumulative count of Article Views (full-text article views including HTML views, PDF and ePub downloads, according to the available data) and Abstracts Views on Vision4Press platform.
Data correspond to usage on the plateform after 2015. The current usage metrics is available 48-96 hours after online publication and is updated daily on week days.
Initial download of the metrics may take a while.