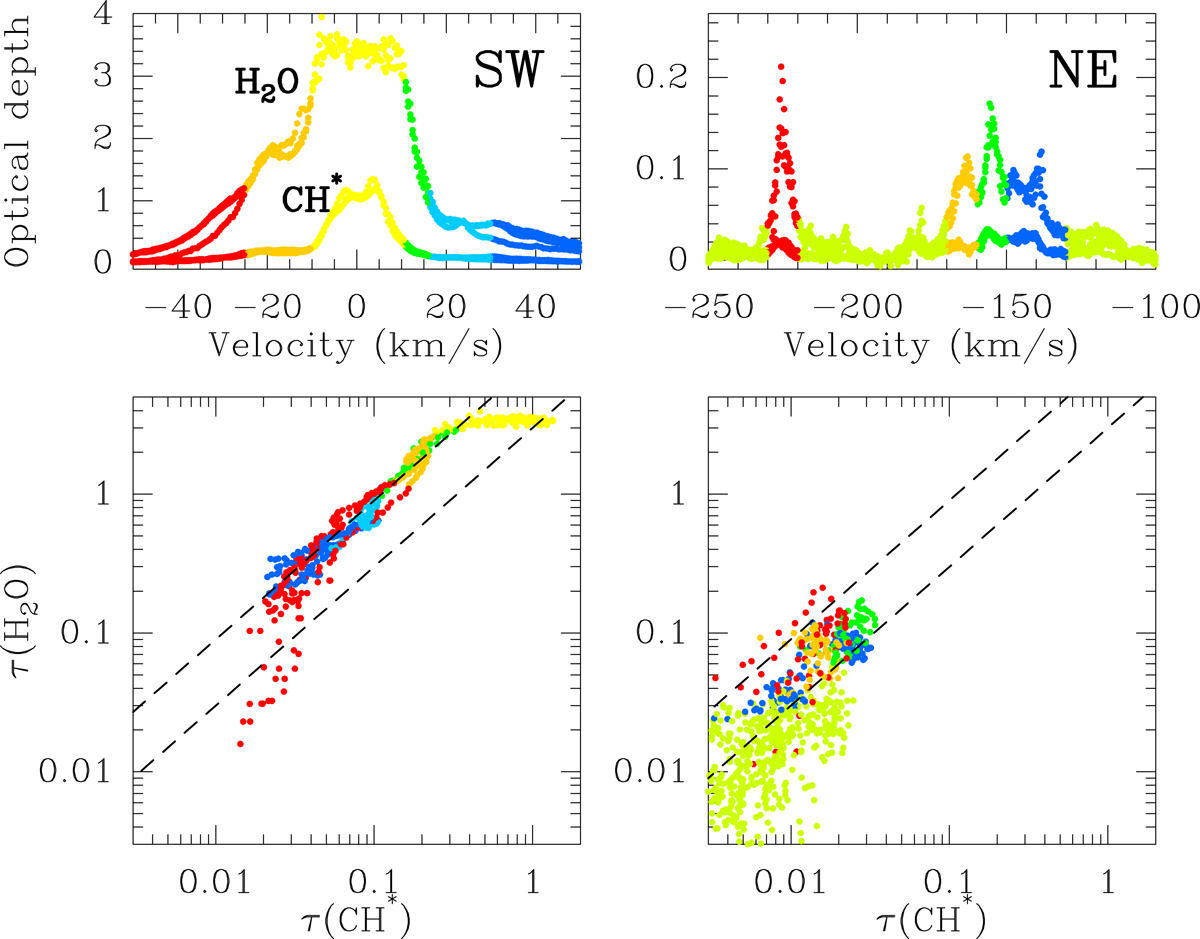
Fig. 18.
Download original image
Correlation between the optical depths of the ortho-H2O 11, 0 − 10, 1 line and of the deconvolved profile of CH 3/2–1/2 (given for an equivalent hyperfine component with normalized intensity Sul = 1) along the SW (left) and NE (right) lines of sight, respectively. In both lines of sight, we assume a source-covering factor of fc = 1. The colors encode the velocity intervals shown on the line profiles (top). The dashed lines correspond to opacity ratios τ(H2O)/τ(CH*) = 3 and 9, respectively.
Current usage metrics show cumulative count of Article Views (full-text article views including HTML views, PDF and ePub downloads, according to the available data) and Abstracts Views on Vision4Press platform.
Data correspond to usage on the plateform after 2015. The current usage metrics is available 48-96 hours after online publication and is updated daily on week days.
Initial download of the metrics may take a while.