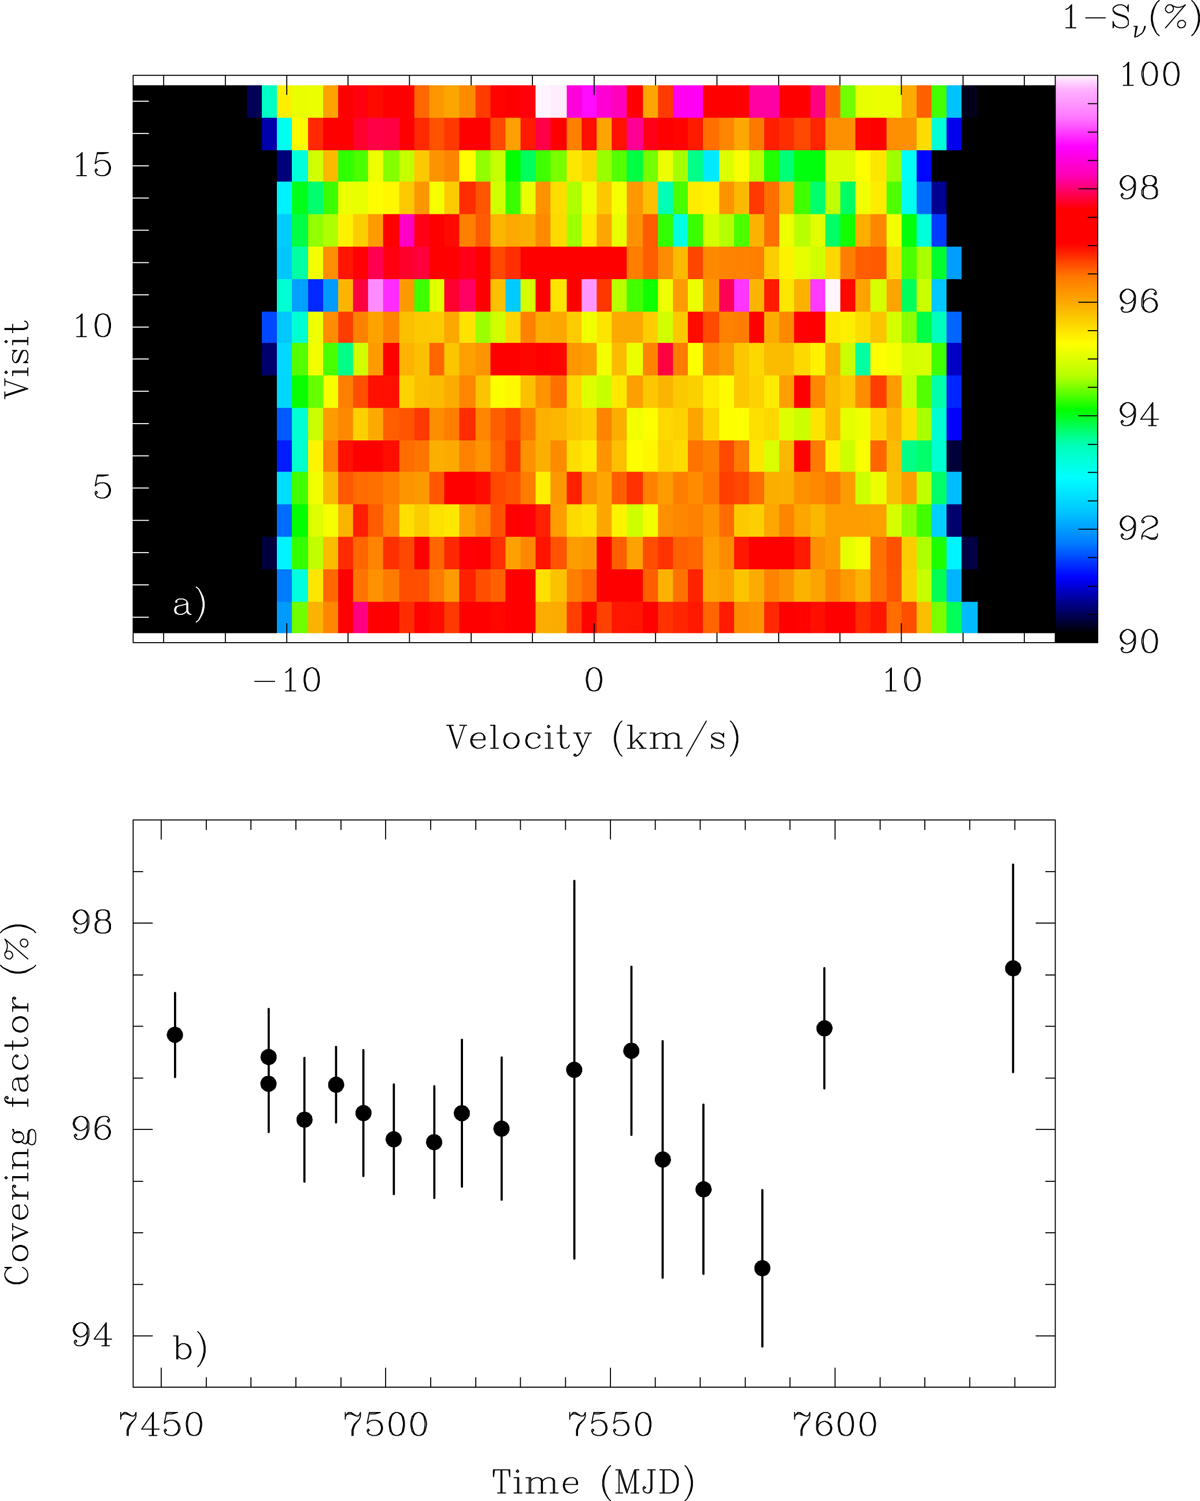
Fig. 17.
Download original image
Measurements of the covering factor across the different visits of our 2016 monitoring. (a) Saturation level (1 − Sν) at the center of the H2O line for all the visits in 2016. (b) The values of all spectral channels with velocities |v|< 8 km s−1 are averaged to provide measurements of the continuum-covering factor as a function of time.
Current usage metrics show cumulative count of Article Views (full-text article views including HTML views, PDF and ePub downloads, according to the available data) and Abstracts Views on Vision4Press platform.
Data correspond to usage on the plateform after 2015. The current usage metrics is available 48-96 hours after online publication and is updated daily on week days.
Initial download of the metrics may take a while.