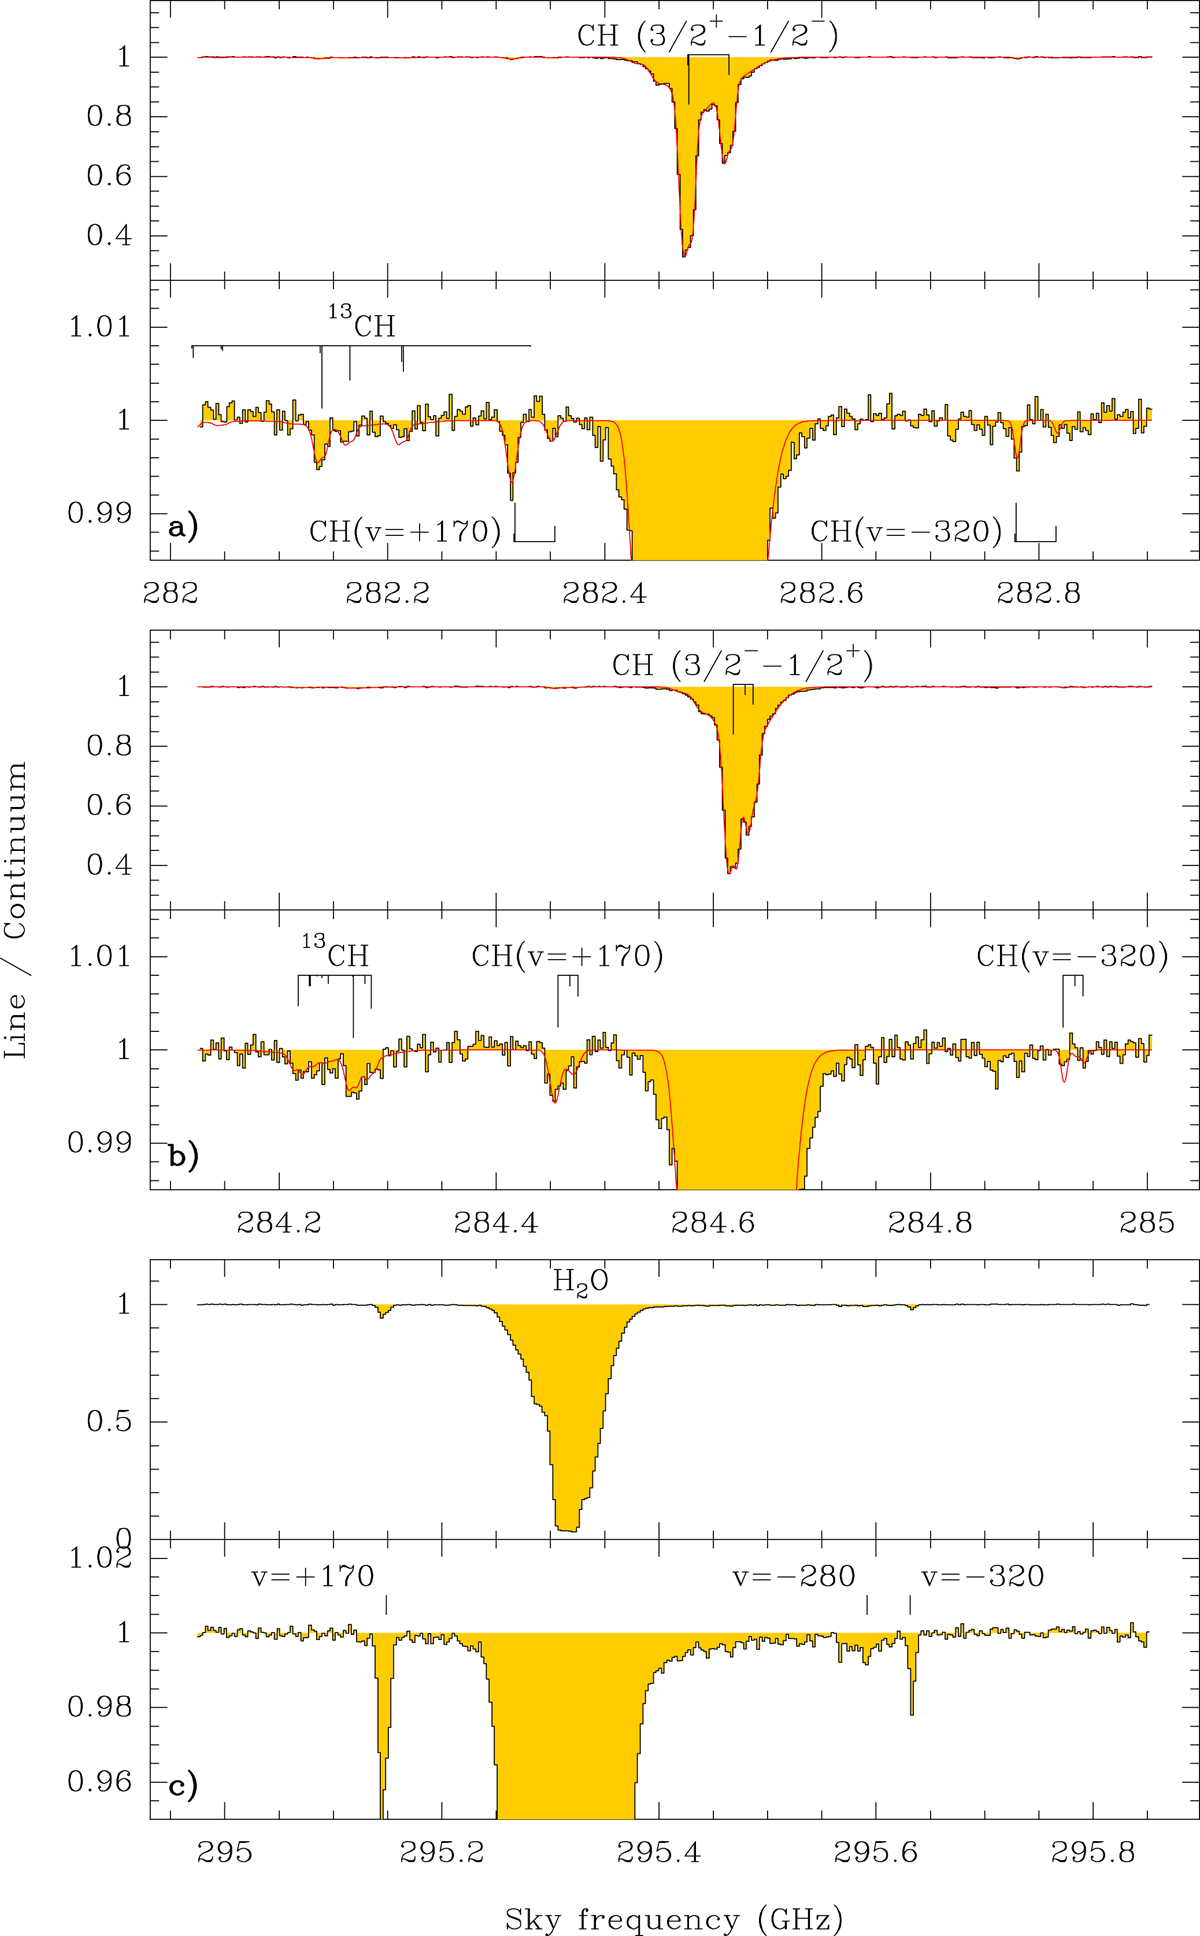
Fig. 15.
Download original image
Weighted-average spectra toward the SW image of PKS 1830−211, combining all visits in 2016. The hyperfine structure is shown for each CH Λ-doublet, with the strongest hfs component set at a velocity v = 0 km s−1, or as indicated otherwise. There are two boxes for each line, the first one showing the whole absorption spectrum and the second one showing a smaller range around the continuum level. Best-fit of the CH and 13CH absorption is shown in red.
Current usage metrics show cumulative count of Article Views (full-text article views including HTML views, PDF and ePub downloads, according to the available data) and Abstracts Views on Vision4Press platform.
Data correspond to usage on the plateform after 2015. The current usage metrics is available 48-96 hours after online publication and is updated daily on week days.
Initial download of the metrics may take a while.