Fig. 1.
Download original image
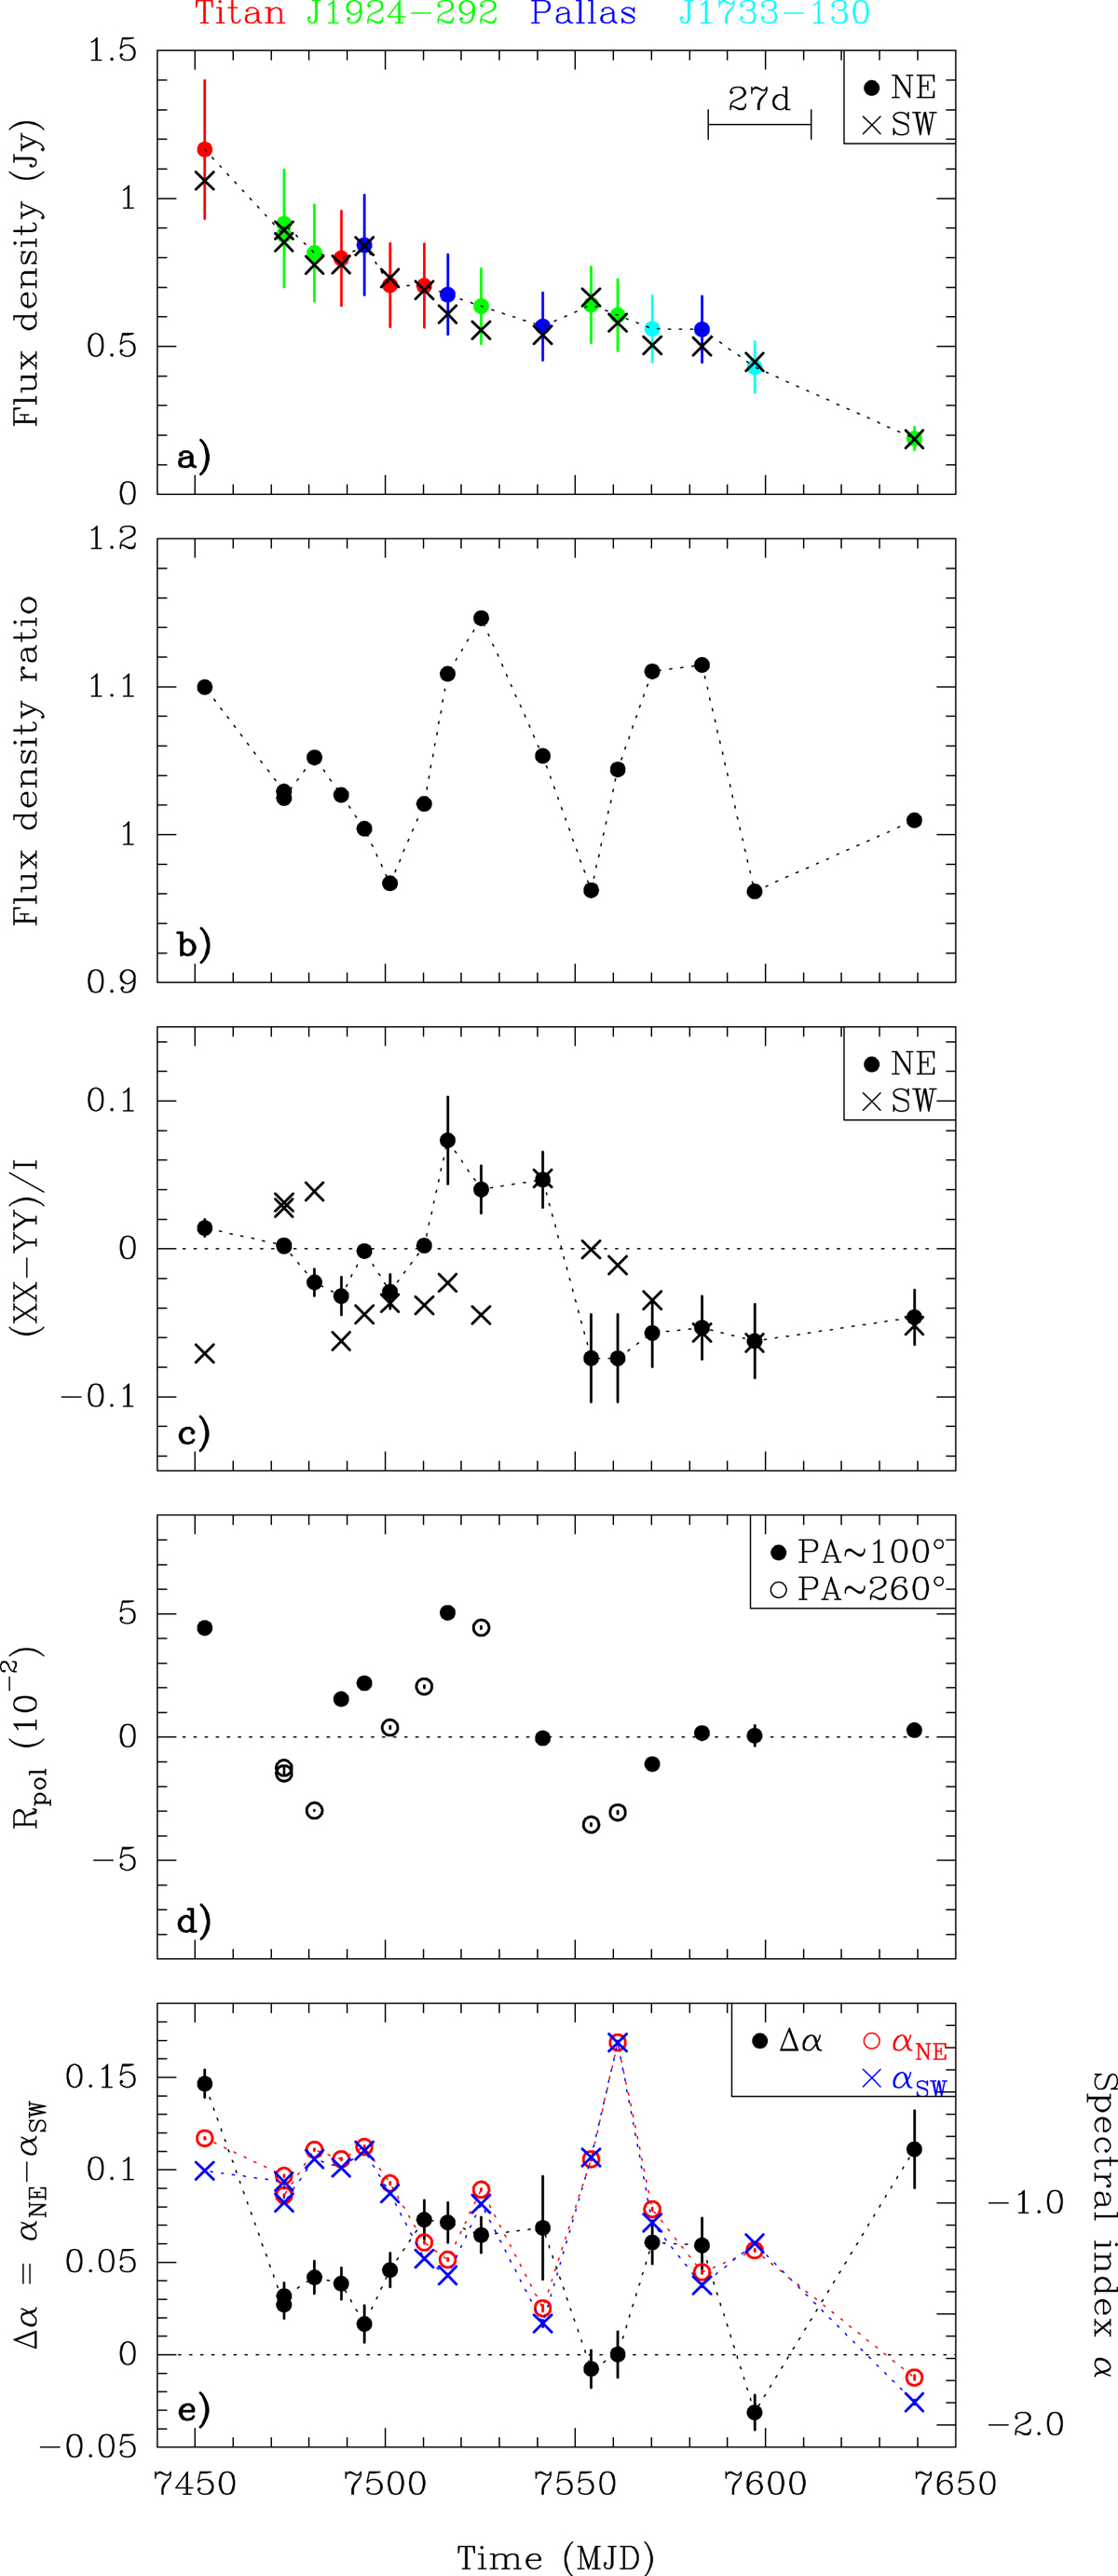
Time evolution of the continuum properties of PKS 1830−211 during our monitoring in 2016 (see Table 1): (a) Flux density of the NE and SW images (error bars of 20% are indicated for the NE image data points only; the color code indicates the source used for flux density calibration). (b) NE/SW flux density ratio. (c) Difference in flux density between the XX and YY polarizers normalized by the Stokes I flux density. (d) Polarization ratio ℛpol (values are encoded as a function of the PA of the observations). (e) Difference in spectral index. The expected time delay of ∼27 days between the two lensed images of the quasar is indicated in panel a.
Current usage metrics show cumulative count of Article Views (full-text article views including HTML views, PDF and ePub downloads, according to the available data) and Abstracts Views on Vision4Press platform.
Data correspond to usage on the plateform after 2015. The current usage metrics is available 48-96 hours after online publication and is updated daily on week days.
Initial download of the metrics may take a while.