Fig. 6.
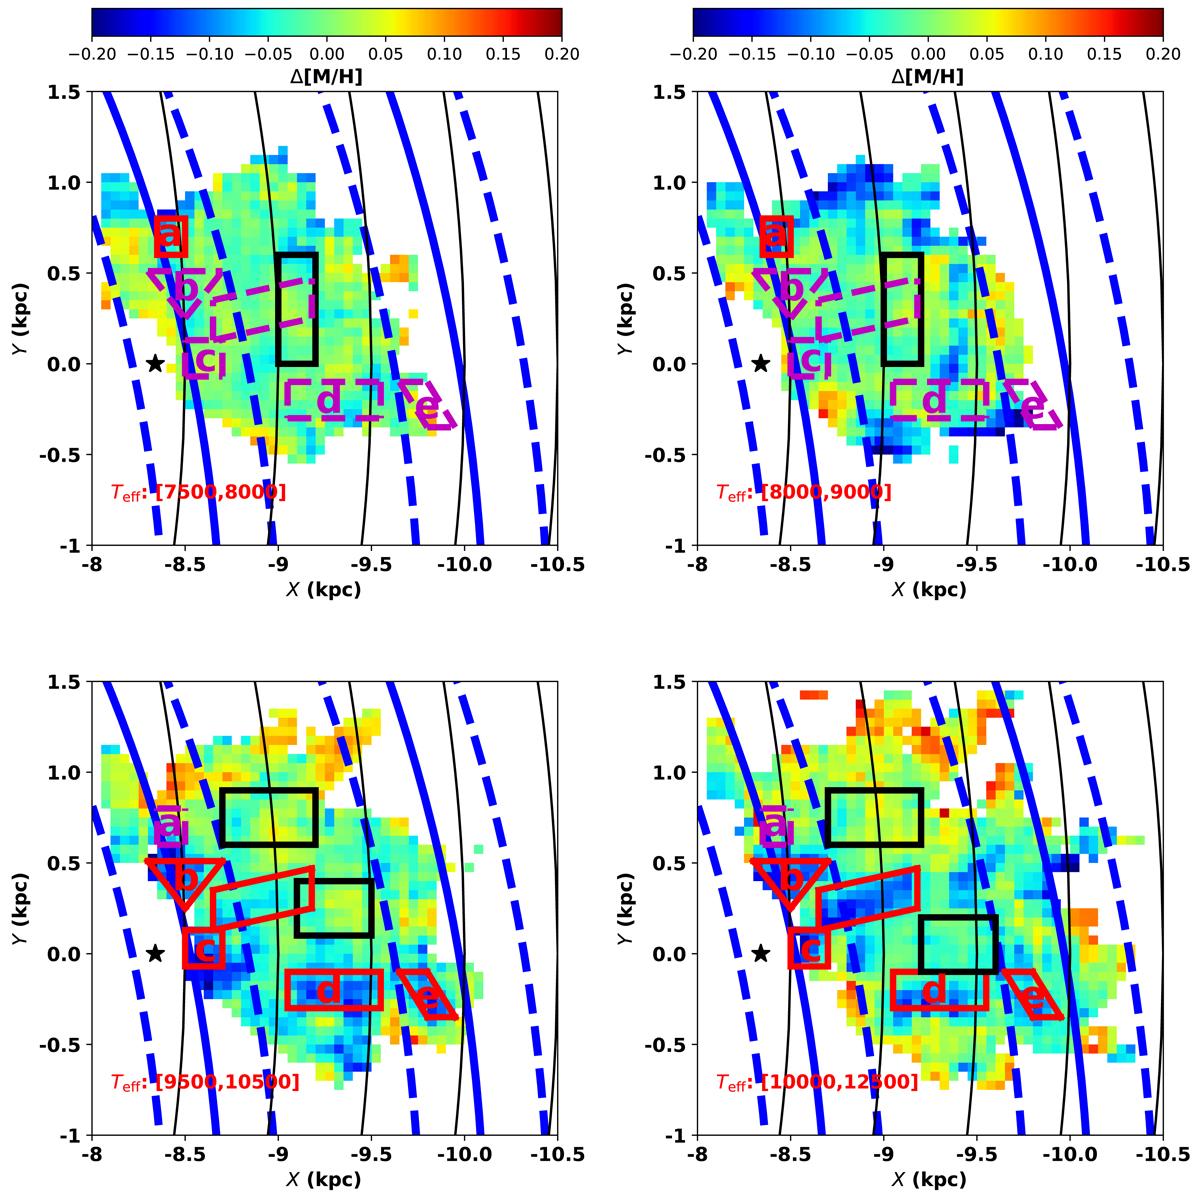
Download original image
Metallicity excess distributions after subtracting radial metallicity gradients for these four mono-temperature stellar populations, binned by 0.1 × 0.1 kpc on the X–Y plane. Bins that contained fewer than eight stars were discarded. The minimum number of stars in each bin was selected to ensure that the median metallicity excess uncertainties produced in these bins could distinguish the metal-poor substructures from other regions. The positions at R = 8.5, 9.0, 9.5, 10.0, and 10.5 kpc are marked with black arcs. The black star symbol indicates the position of the Sun. The centre and 1σ width of the spiral arms are shown by solid and dashed blue lines in all panels. Regions framed in red lines and dashed magenta lines indicate the spatial positions of these five metal-poor substructures (labelled by a, b, c, d, and e). A region framed by red lines means that it is a real metal-poor substructure of this mono-temperature stellar population. The region framed by dashed magenta lines is a corresponding region of metal-poor substructure in other mono-temperature stellar populations. Control regions are framed in black lines.
Current usage metrics show cumulative count of Article Views (full-text article views including HTML views, PDF and ePub downloads, according to the available data) and Abstracts Views on Vision4Press platform.
Data correspond to usage on the plateform after 2015. The current usage metrics is available 48-96 hours after online publication and is updated daily on week days.
Initial download of the metrics may take a while.