Fig. 3.
Download original image
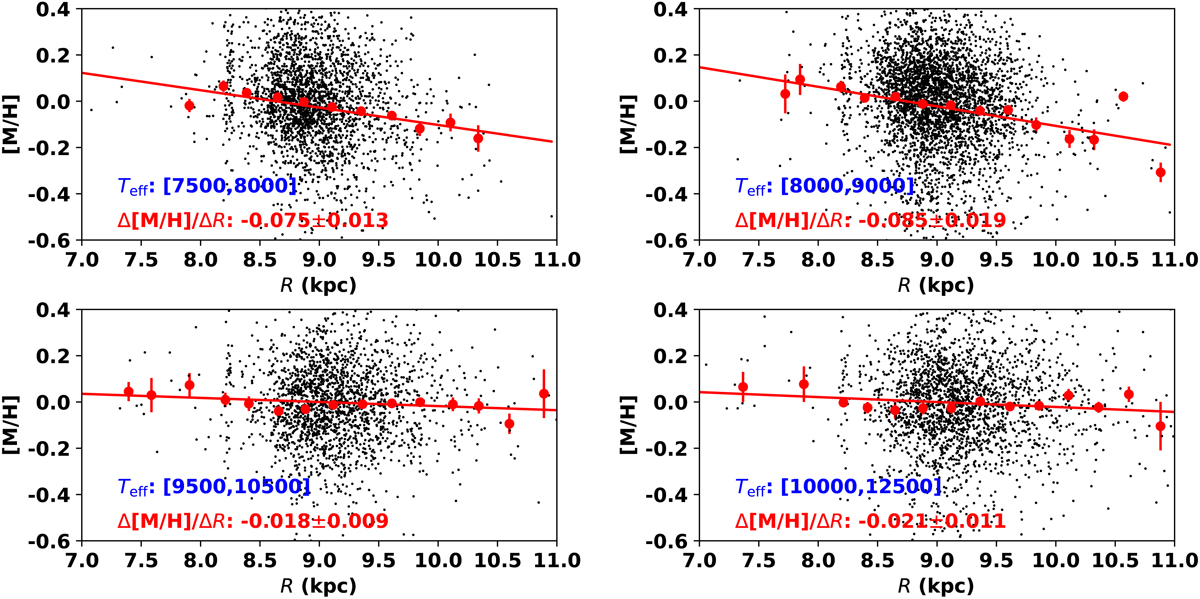
Radial metallicity gradients of these four mono-temperature stellar populations. The red symbols represent the median metallicity values in individual radial bins. The line in red represents the linear regression over the red symbols. The temperature range of each stellar population, the slope of the linear fit (the radial metallicity gradient), and its associated uncertainty are marked in the bottom left panel.
Current usage metrics show cumulative count of Article Views (full-text article views including HTML views, PDF and ePub downloads, according to the available data) and Abstracts Views on Vision4Press platform.
Data correspond to usage on the plateform after 2015. The current usage metrics is available 48-96 hours after online publication and is updated daily on week days.
Initial download of the metrics may take a while.