Fig. 2.
Download original image
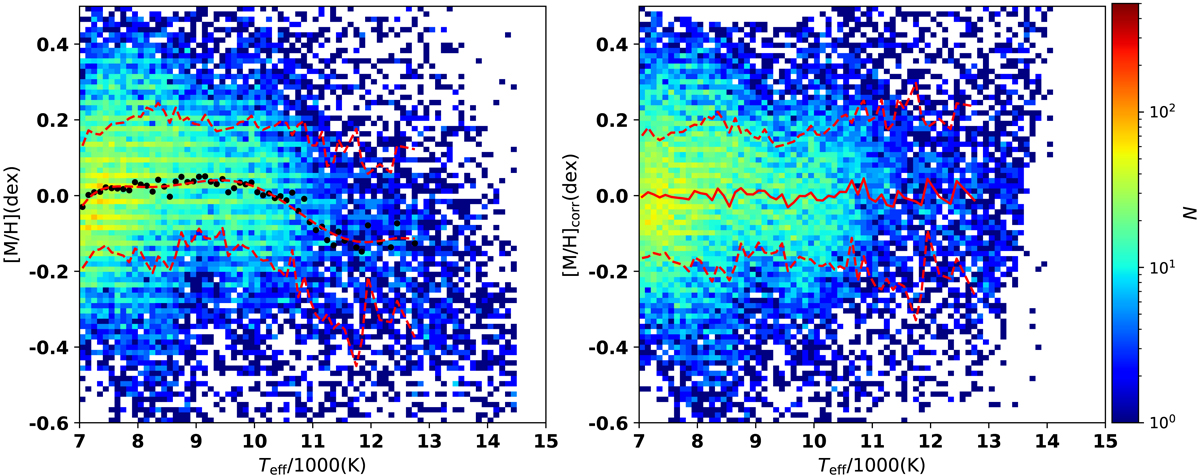
Stellar number density distributions on the effective temperature and metallicity planes. The left panel displays the relation between the estimated metallicity and Teff (black symbols) and their corresponding polynomial fit (red solid line) for the LAMOST-MRS young stellar sample. The black symbol represents the mean estimated metallicity and Teff in each Teff bin with a ΔTeff of 100 K. The dashed red lines represent the corresponding standard deviations of the metallicity in each Teff bin. Additionally, the stellar number density distribution on the Teff-[M/H] plane is plotted in the left panel. The right panel shows the stellar number density distribution on the Teff-[M/H]corr plane. The solid and dashed red lines represent the mean corrected metallicity values and the corresponding standard deviations of the metallicity in each Teff bin, respectively.
Current usage metrics show cumulative count of Article Views (full-text article views including HTML views, PDF and ePub downloads, according to the available data) and Abstracts Views on Vision4Press platform.
Data correspond to usage on the plateform after 2015. The current usage metrics is available 48-96 hours after online publication and is updated daily on week days.
Initial download of the metrics may take a while.