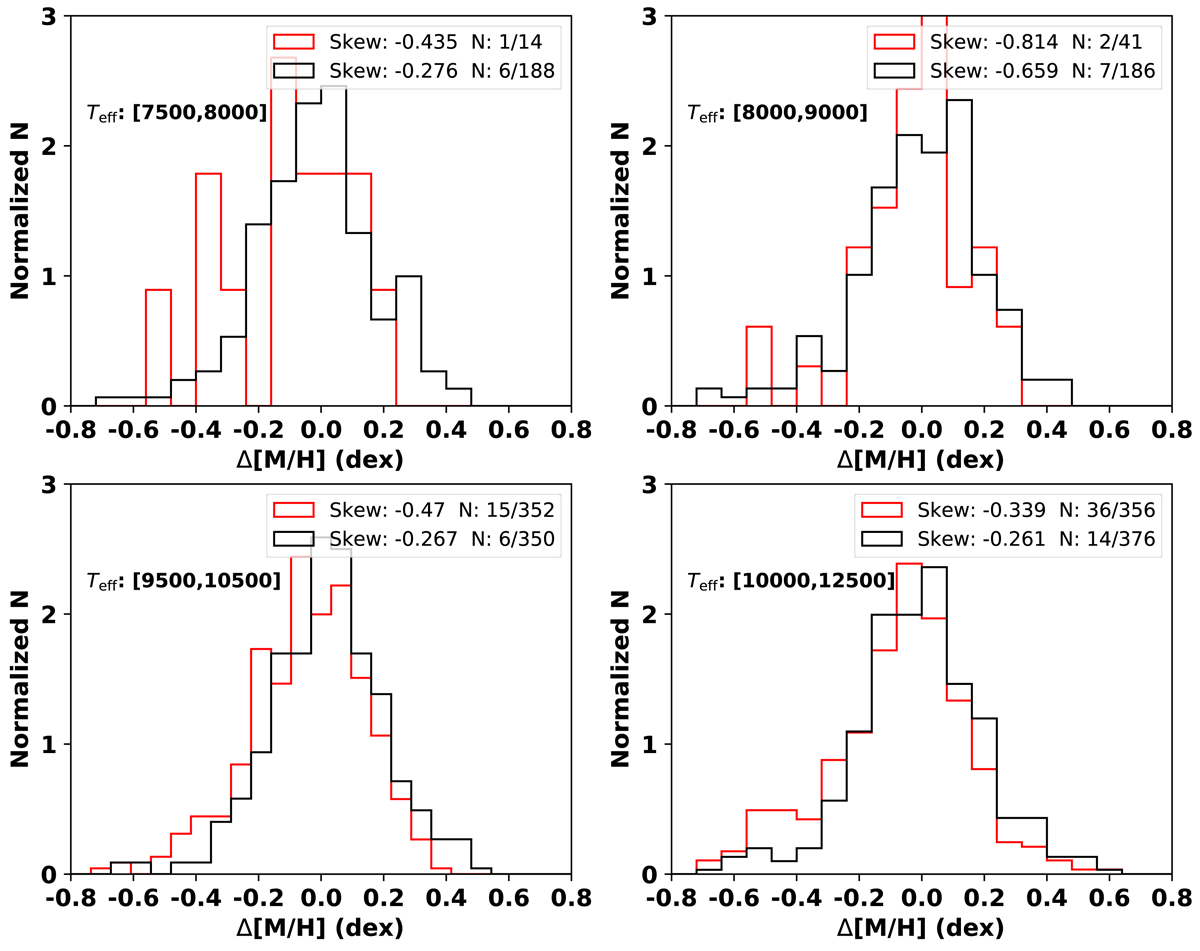
Fig. A.5.
Download original image
Metallicity excess distributions in metal-poor regions (red histogram) and their control regions (black histogram) of these four mono-temperature stellar populations. The skewness of these distributions is estimated and labelled in the top right corner of each panel. The total number and the number of stars with [M/H]corr < −0.4 dex are also shown in the figure.
Current usage metrics show cumulative count of Article Views (full-text article views including HTML views, PDF and ePub downloads, according to the available data) and Abstracts Views on Vision4Press platform.
Data correspond to usage on the plateform after 2015. The current usage metrics is available 48-96 hours after online publication and is updated daily on week days.
Initial download of the metrics may take a while.