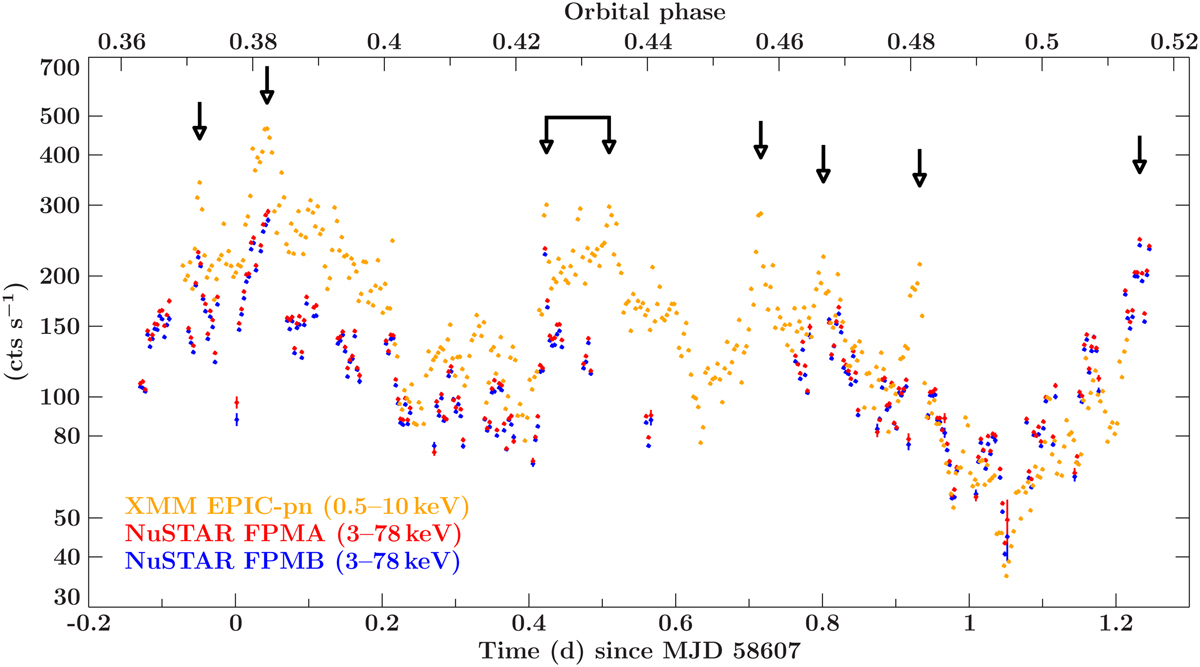
Fig. 2
Download original image
Light curves for XMM-Newton EPIC-pn (orange), NuSTAR FPMA (red), and FPMB (blue) with a time resolution of P = 283.44 s. The count rate is plotted on the y-axis in logarithmic scale against the orbital phase (top axis) and the time of the observation (bottom axis). Major short flares are indicated by single arrows. The connected arrows at ~58607.42 MJD indicate a flaring episode of ~8 ks.
Current usage metrics show cumulative count of Article Views (full-text article views including HTML views, PDF and ePub downloads, according to the available data) and Abstracts Views on Vision4Press platform.
Data correspond to usage on the plateform after 2015. The current usage metrics is available 48-96 hours after online publication and is updated daily on week days.
Initial download of the metrics may take a while.